


CUSTOM METRICS
Redesigned Custom Metrics: create, label & visualize personalized data with flexible input, aggregation, trends.
INTRODUCTION
The custom metric feature lets users create tailored metrics using formulas based on predefined data (e.g., revenue, impressions, service cost), helping them track performance that matches their business goals.
Although the feature was live, usability issues limited adoption and efficiency. This project improved the experience by addressing those problems, while keeping the core functionality of custom metrics unchanged.
PROJECT
The project focused on redesigning how users create, browse, and manage Custom Metrics inside Swydo’s dashboard builder — moving the flow from a disorienting full-screen settings page into a contextual drawer, with a new formula editor, a lighter overview table, and clearer entry points for adding or editing a metric.
CHALLENGE
Research surfaced a handful of recurring pain points:
Loss of context: the full-screen settings page disoriented users coming from a widget.
Starting from scratch: users had to rebuild their data selection even when arriving with context already.
No clear entry point: it was unclear where to add or edit a metric, and the add button itself was easy to miss.
Dense, noisy tables: the metrics table showed rows that were too large, with mostly irrelevant information.
MY ROLE
I worked as the Product Designer on this project end-to-end — running the usability research, defining the use cases and acceptance criteria, and designing the new drawer-based creation flow, formula editor, and metrics table in close collaboration with product management and engineering.
KEY ISSUES
Full-screen mode
Full-screen mode causes loss of context: Users feel disoriented when entering the custom metric settings page because they lose context of their previous workflow.
Users struggle to find the right data
Users have to start from scratch when selecting data points, even when they are navigating from a widget setting
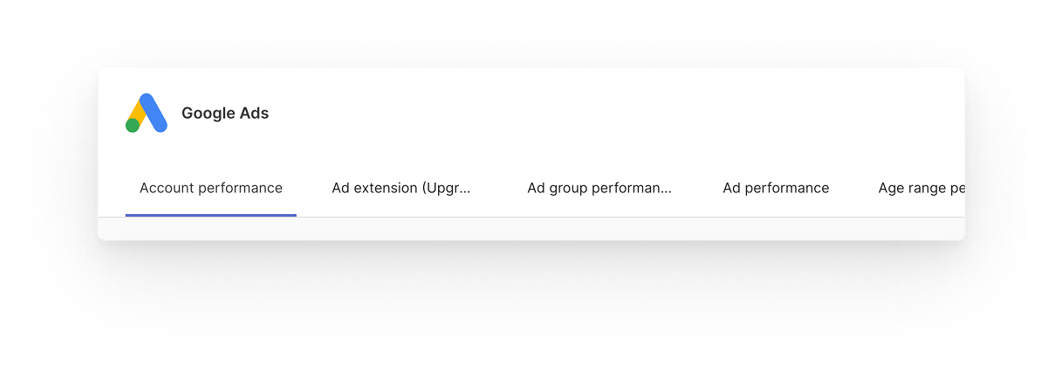
No clarity on where to add/edit metrics
Users experience confusion when first entering the settings page, as it is unclear where to start.
Custom metric button position
Users experience confusion when first entering the settings page, as it is unclear where to start.
Option to scroll and select categories
The category list in the Custom Metrics modal can be confusing—users can add metrics to any category but only see them in widgets using that category. Limiting visible categories based on entry point could improve clarity.
Add category option
Users can add a category from this view, but the button is hidden and lacks context. It’s likely unnecessary and may confuse users who mistake it for 'Add Custom Metric'.

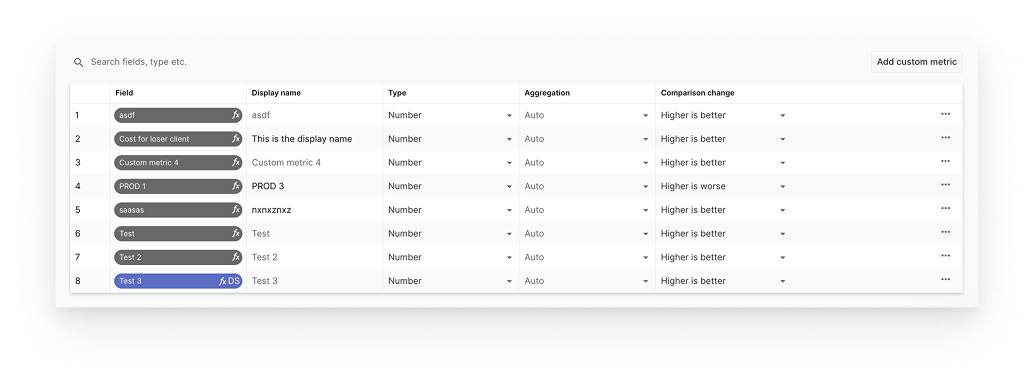
Custom metric table
The Custom Metric table rows are too large and display too much irrelevant information.
Users mainly want a quick overview to see the formula of each metric they've created. Most of the details shown per row are either not needed at this stage or are auto-generated during formula creation, and could be hidden until then.
DESIGN SOLUTION
Creation of a new Custom Metric
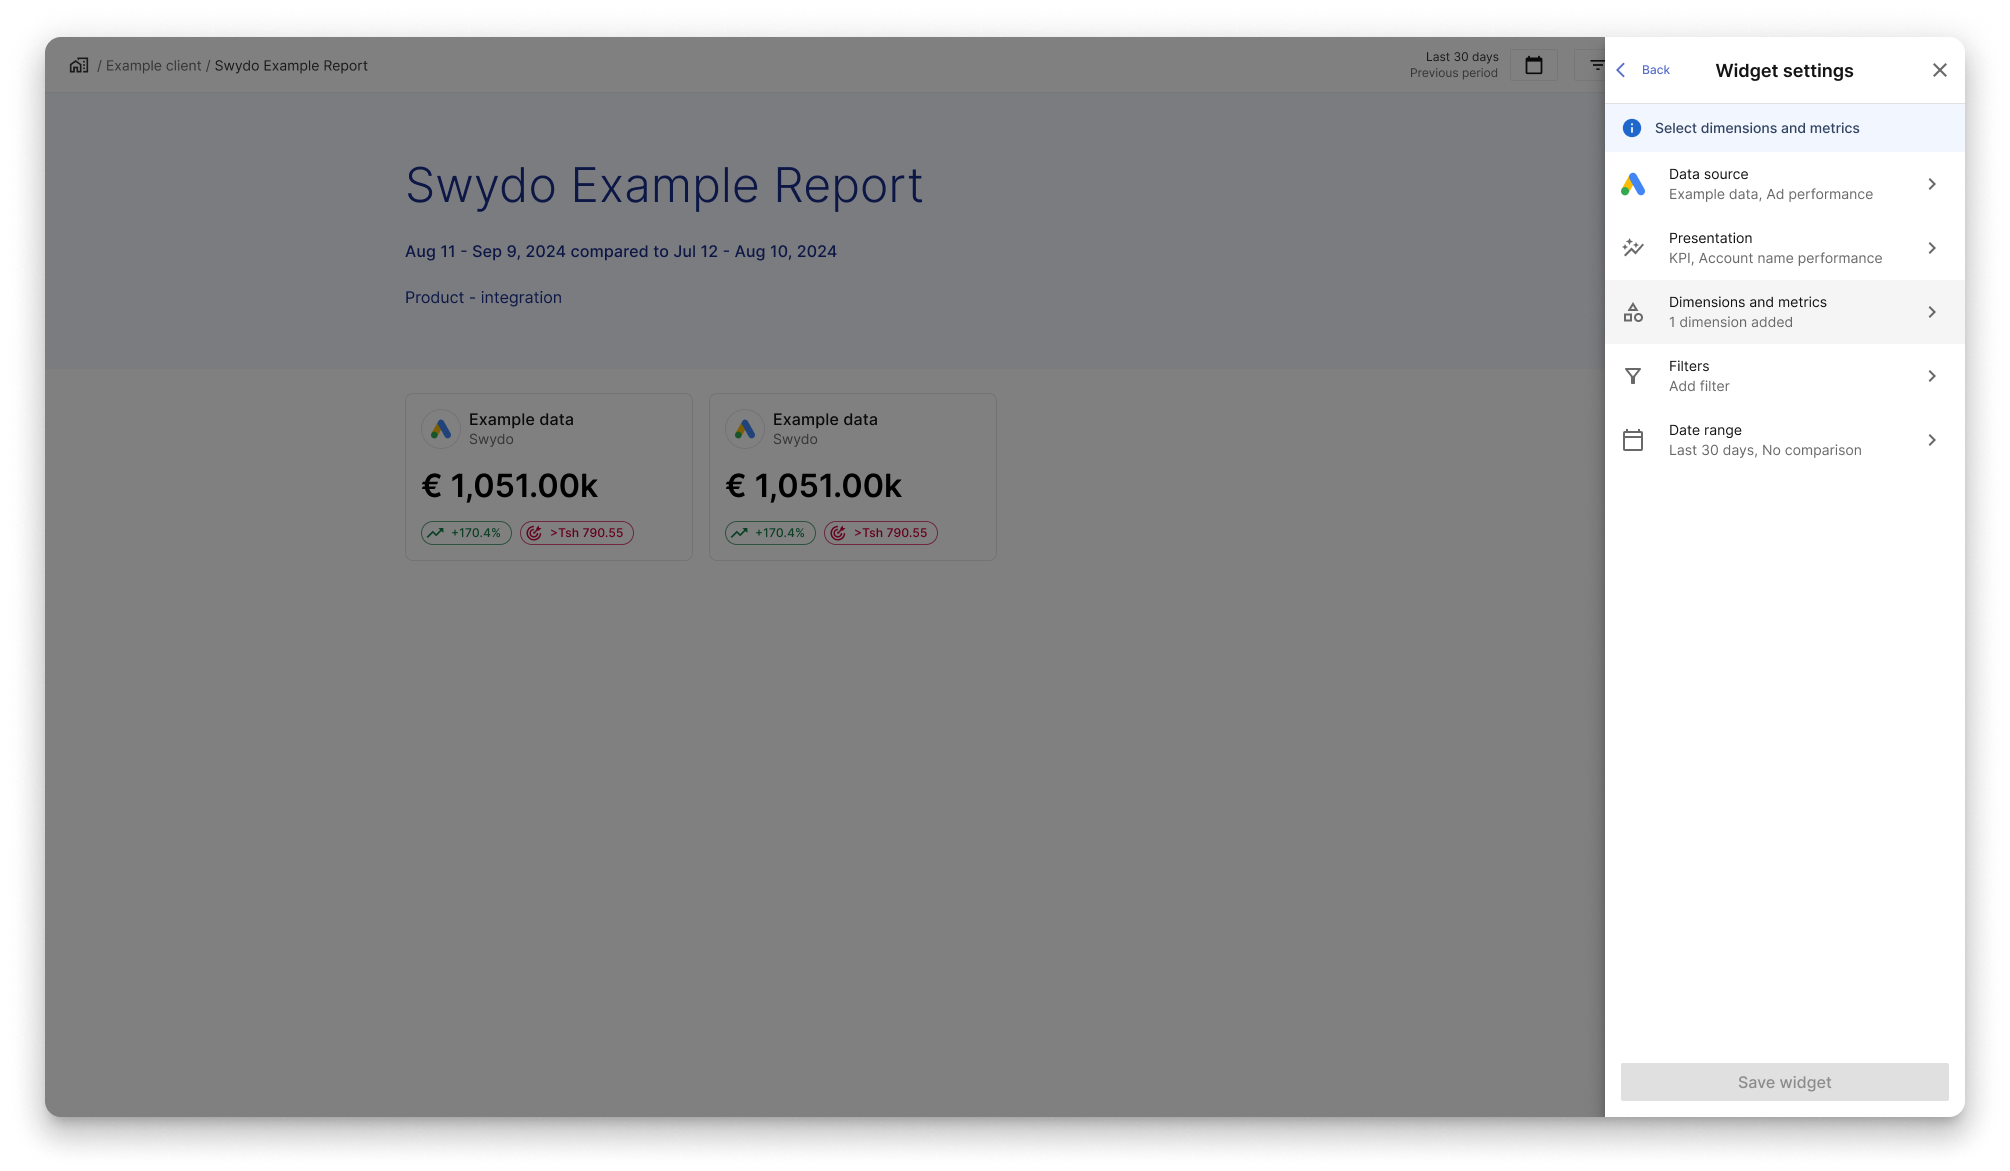
When on widget settings, the users can reach
custom metrics feature from
Dimension and Metrics section.
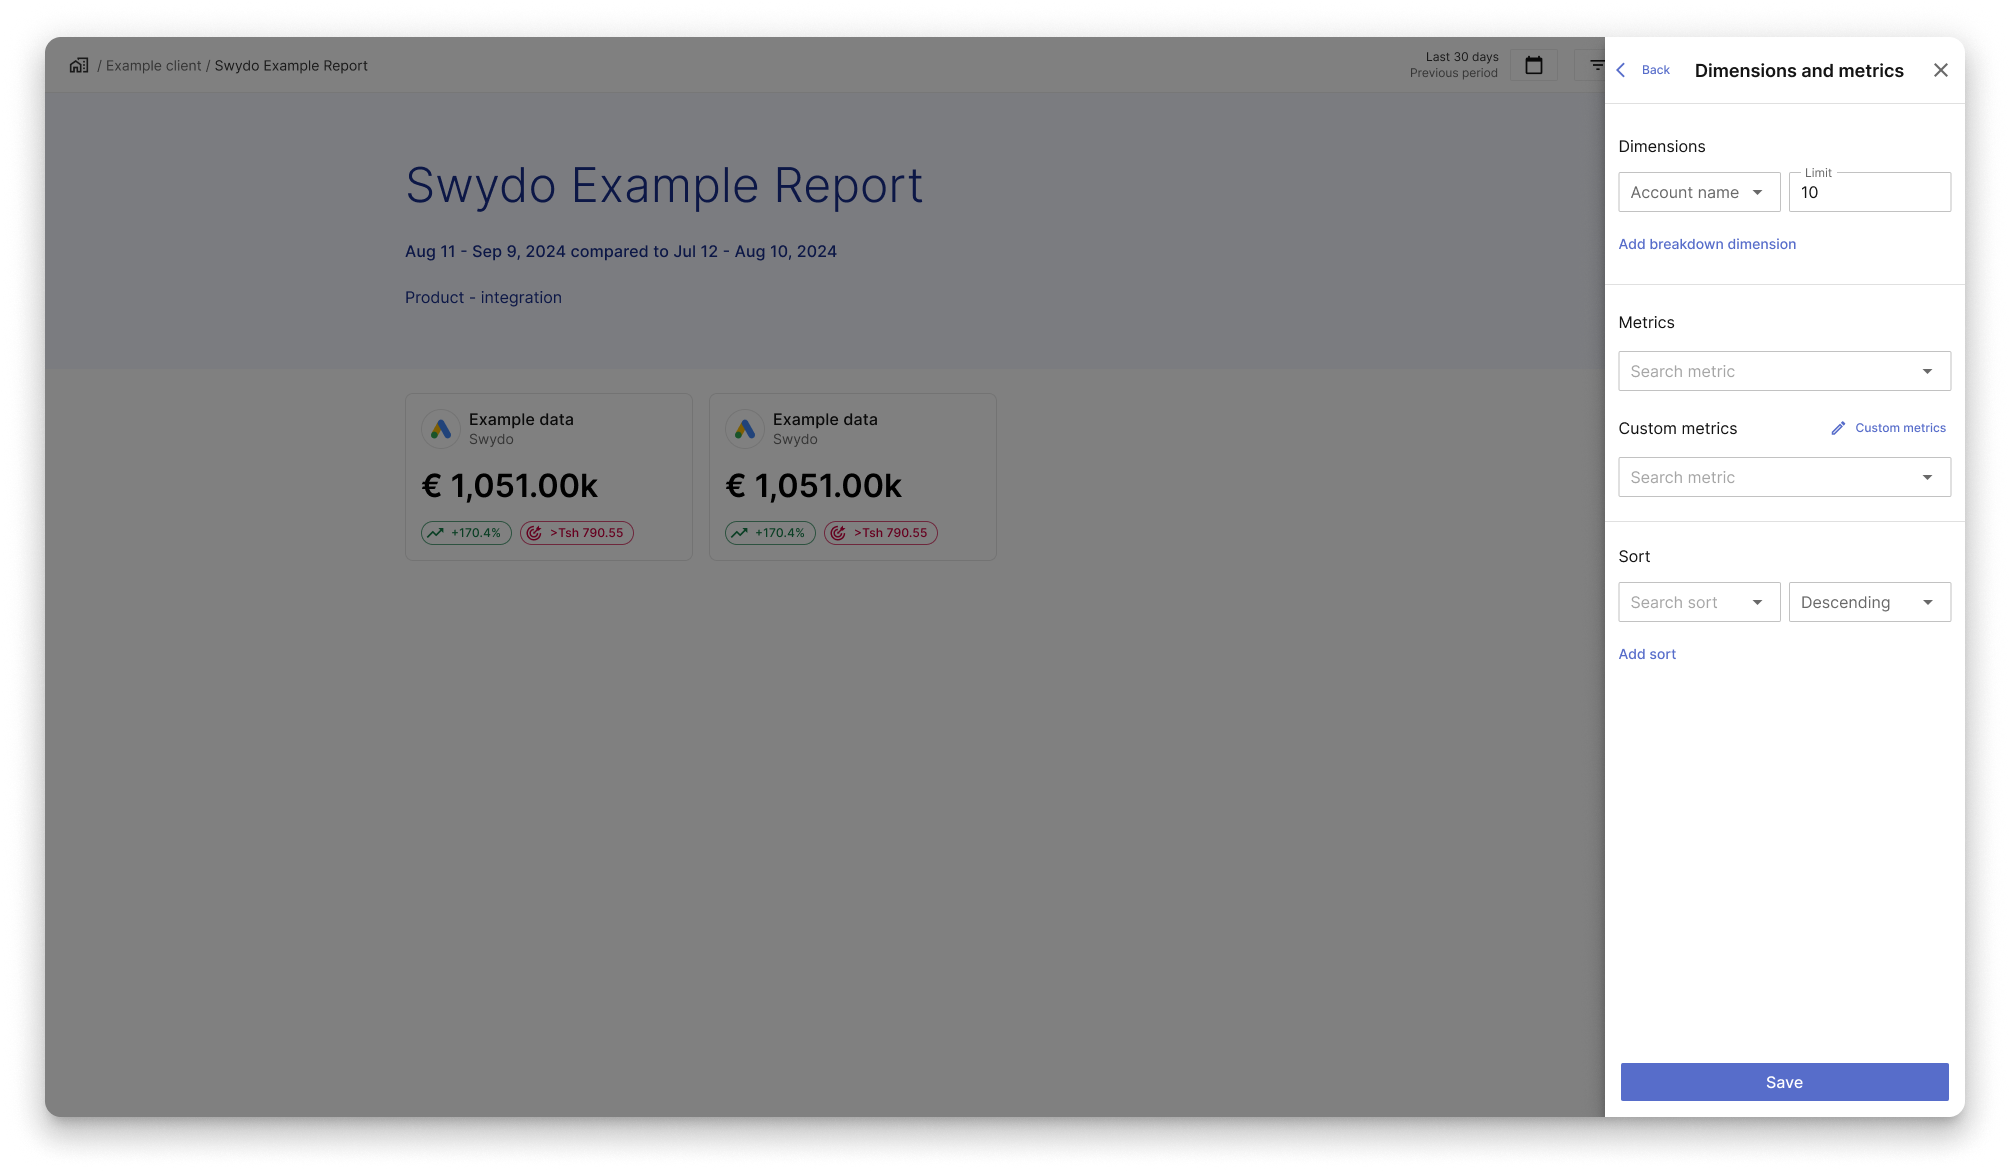
Users can search existing Custom Metrics via the select menu or add a new one
using the “Add Custom Metric” button next to the label.
Clicking it opens the drawer directly at the Custom Metrics level.
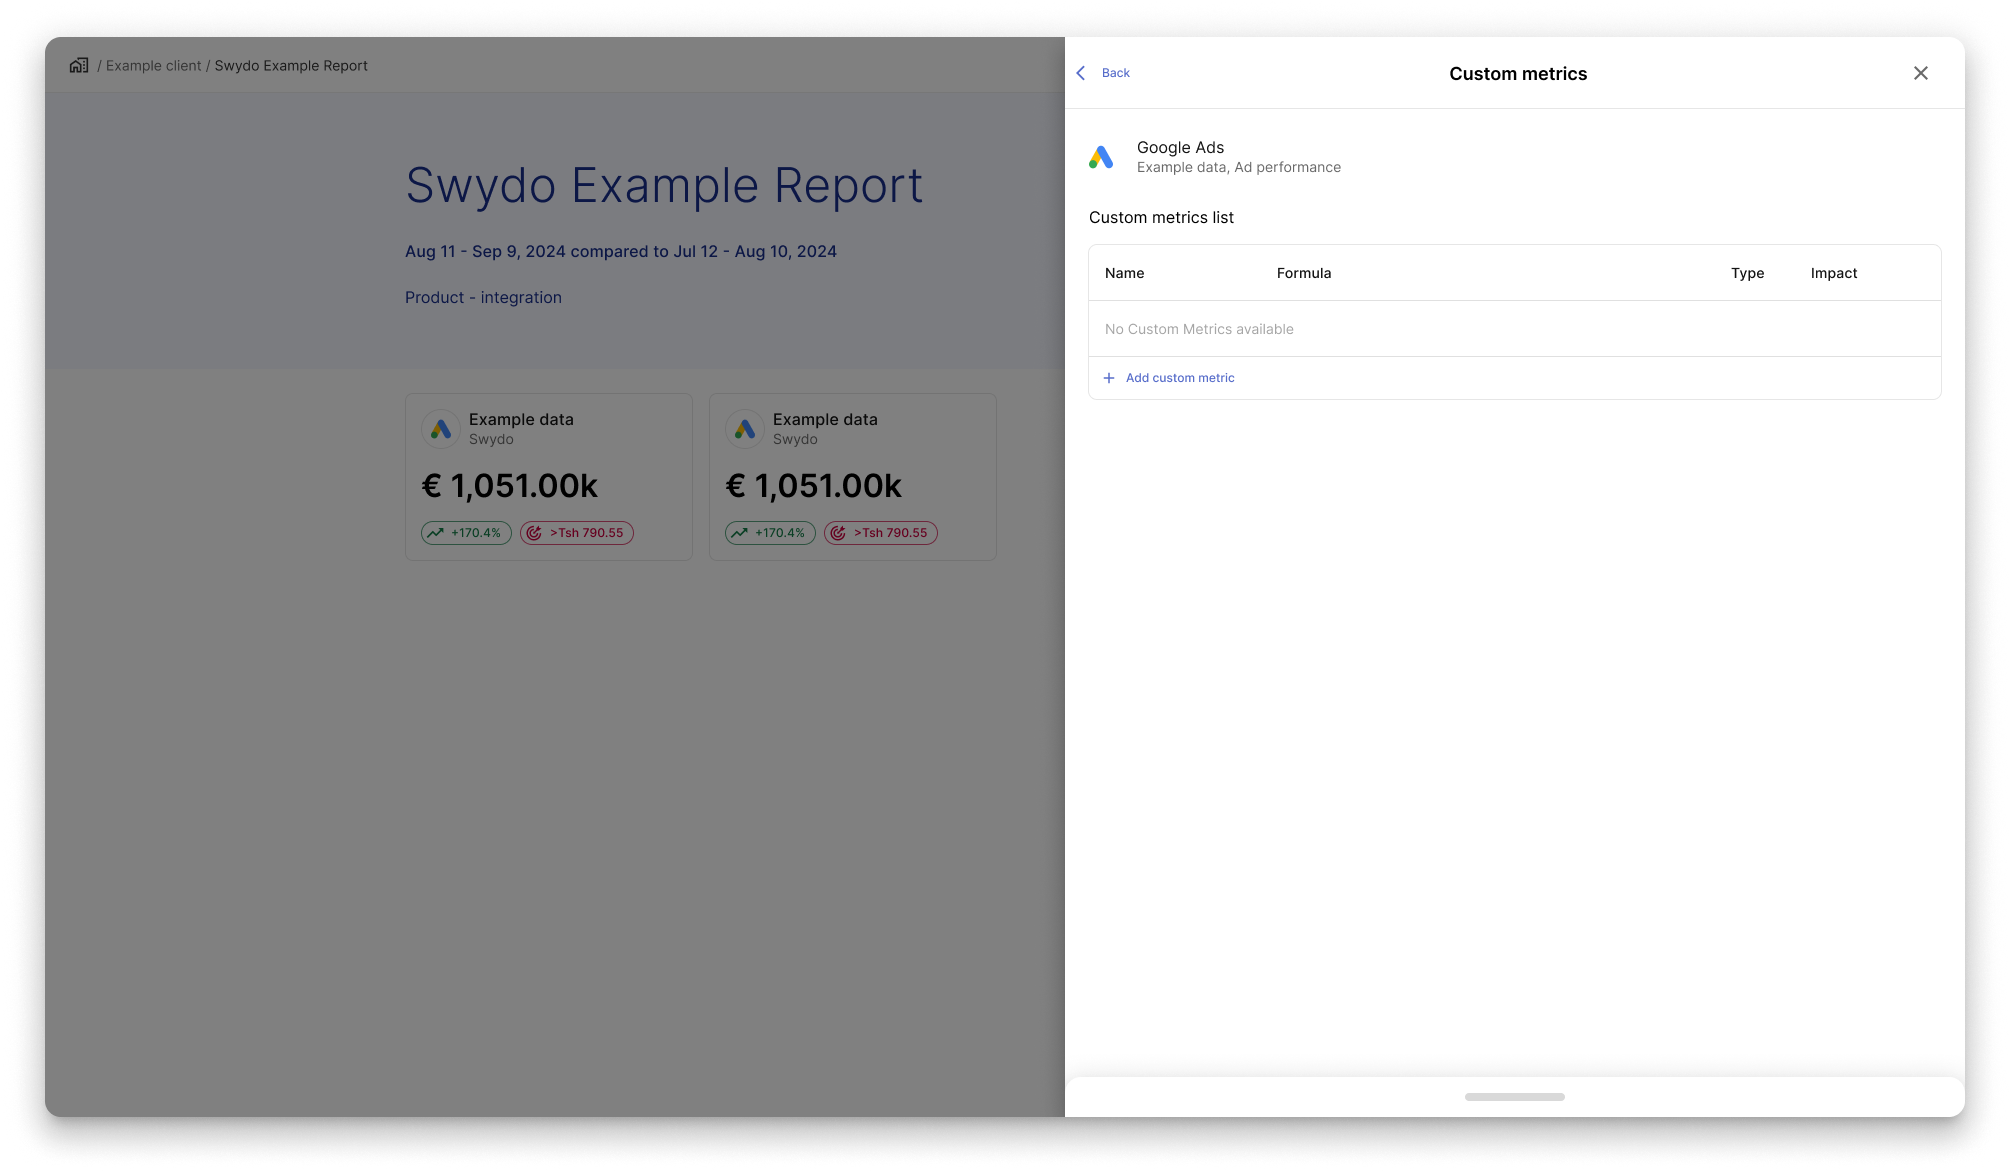
The drawer shows a header with integration name, data source,
and category—matching the widget settings view. Users can now create metrics
only for the widget’s category. Below, a metrics table (or empty state) appears,
with an “Add Custom Metric” button opening a slide-up panel
for contextual, streamlined creation.
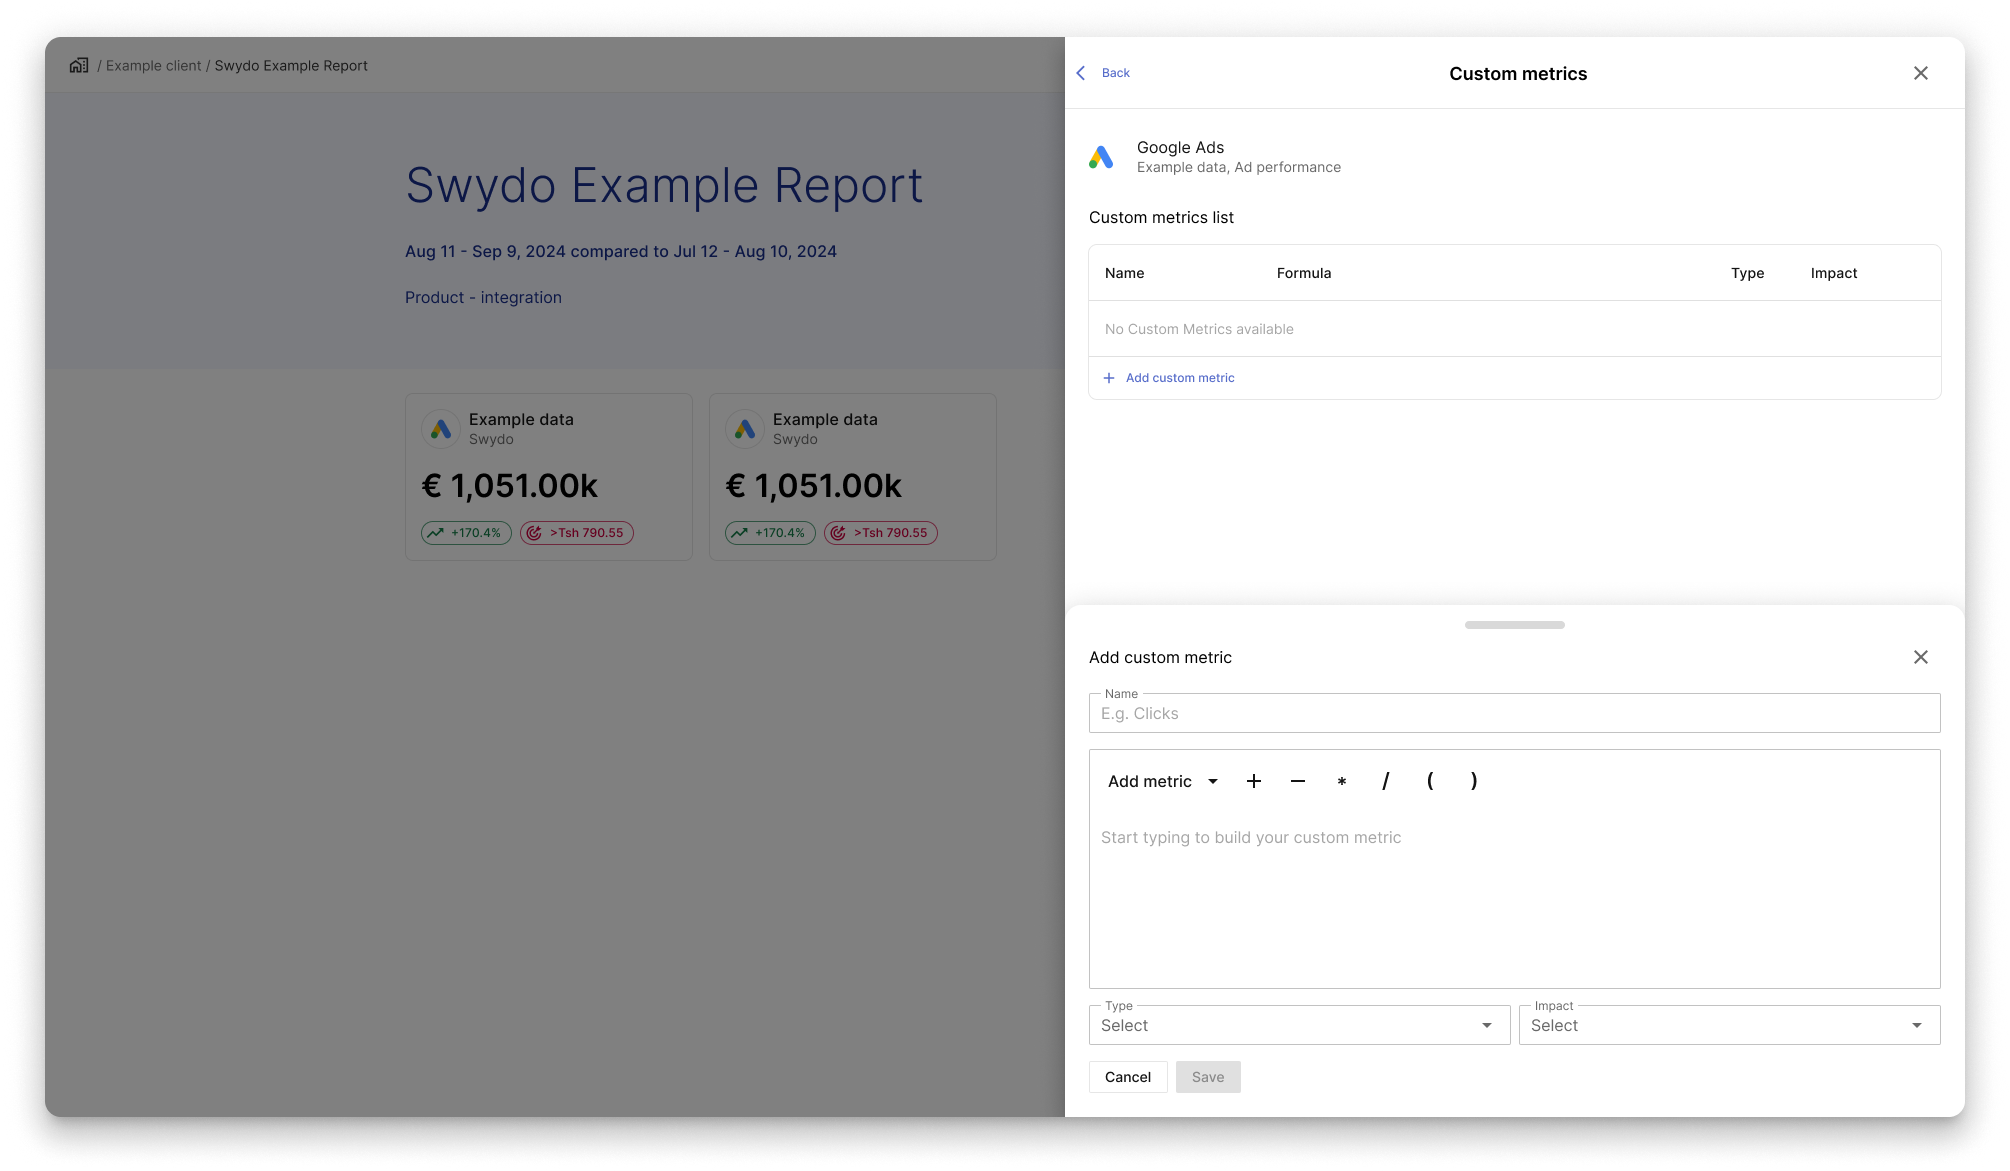
Clicking “Add Custom Metric” or pulling up the handle reveals the formula editor panel.
Users enter a name, build the formula by typing or selecting metrics and operators, set the type
(auto-detected for single metrics or selectable for multiple), and define the impact.
Clicking “Save” adds the metric; closing the panel discards changes.
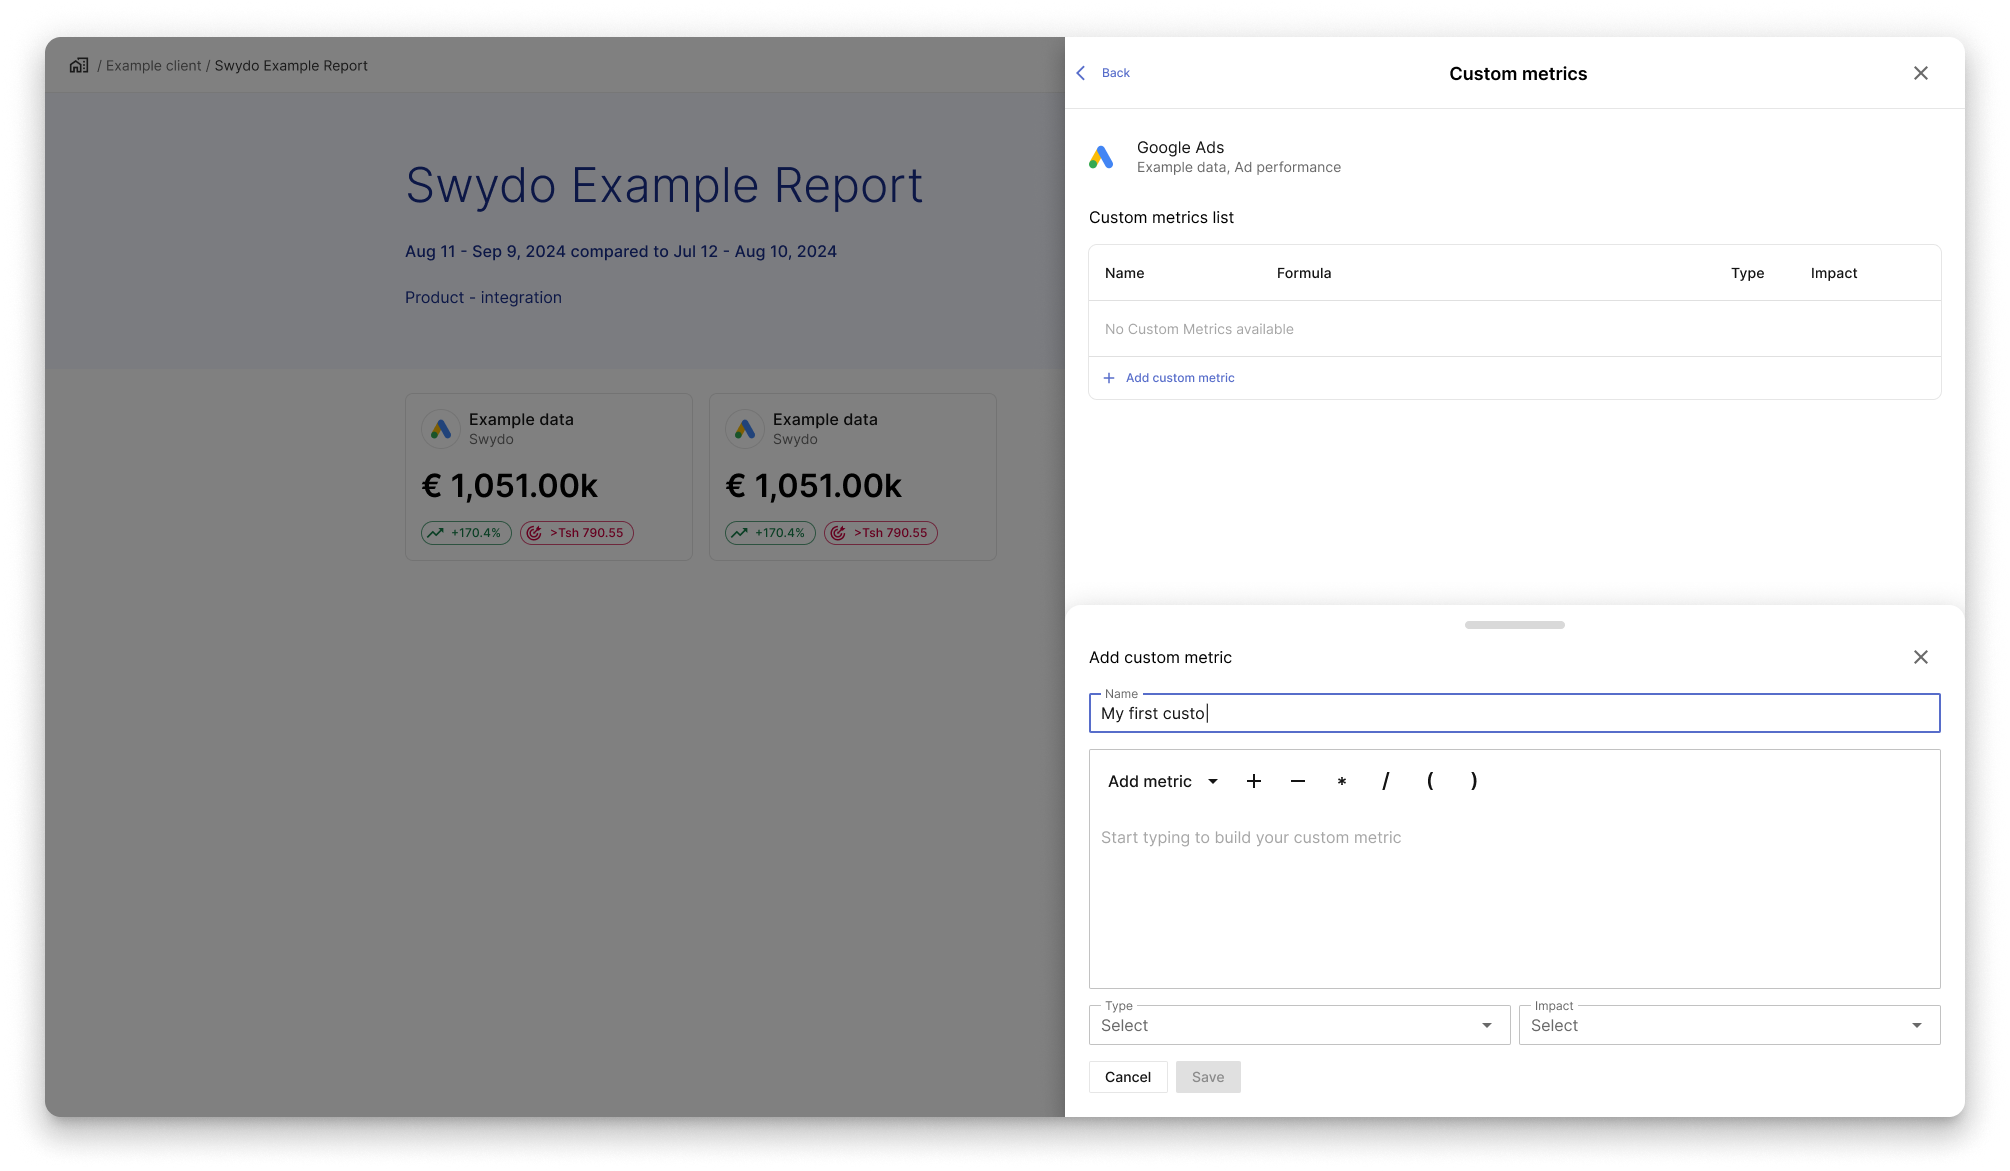
Users can type the name of the custom metric in the relevant input field.
This will be reflected in the first cell of the custom metric row.
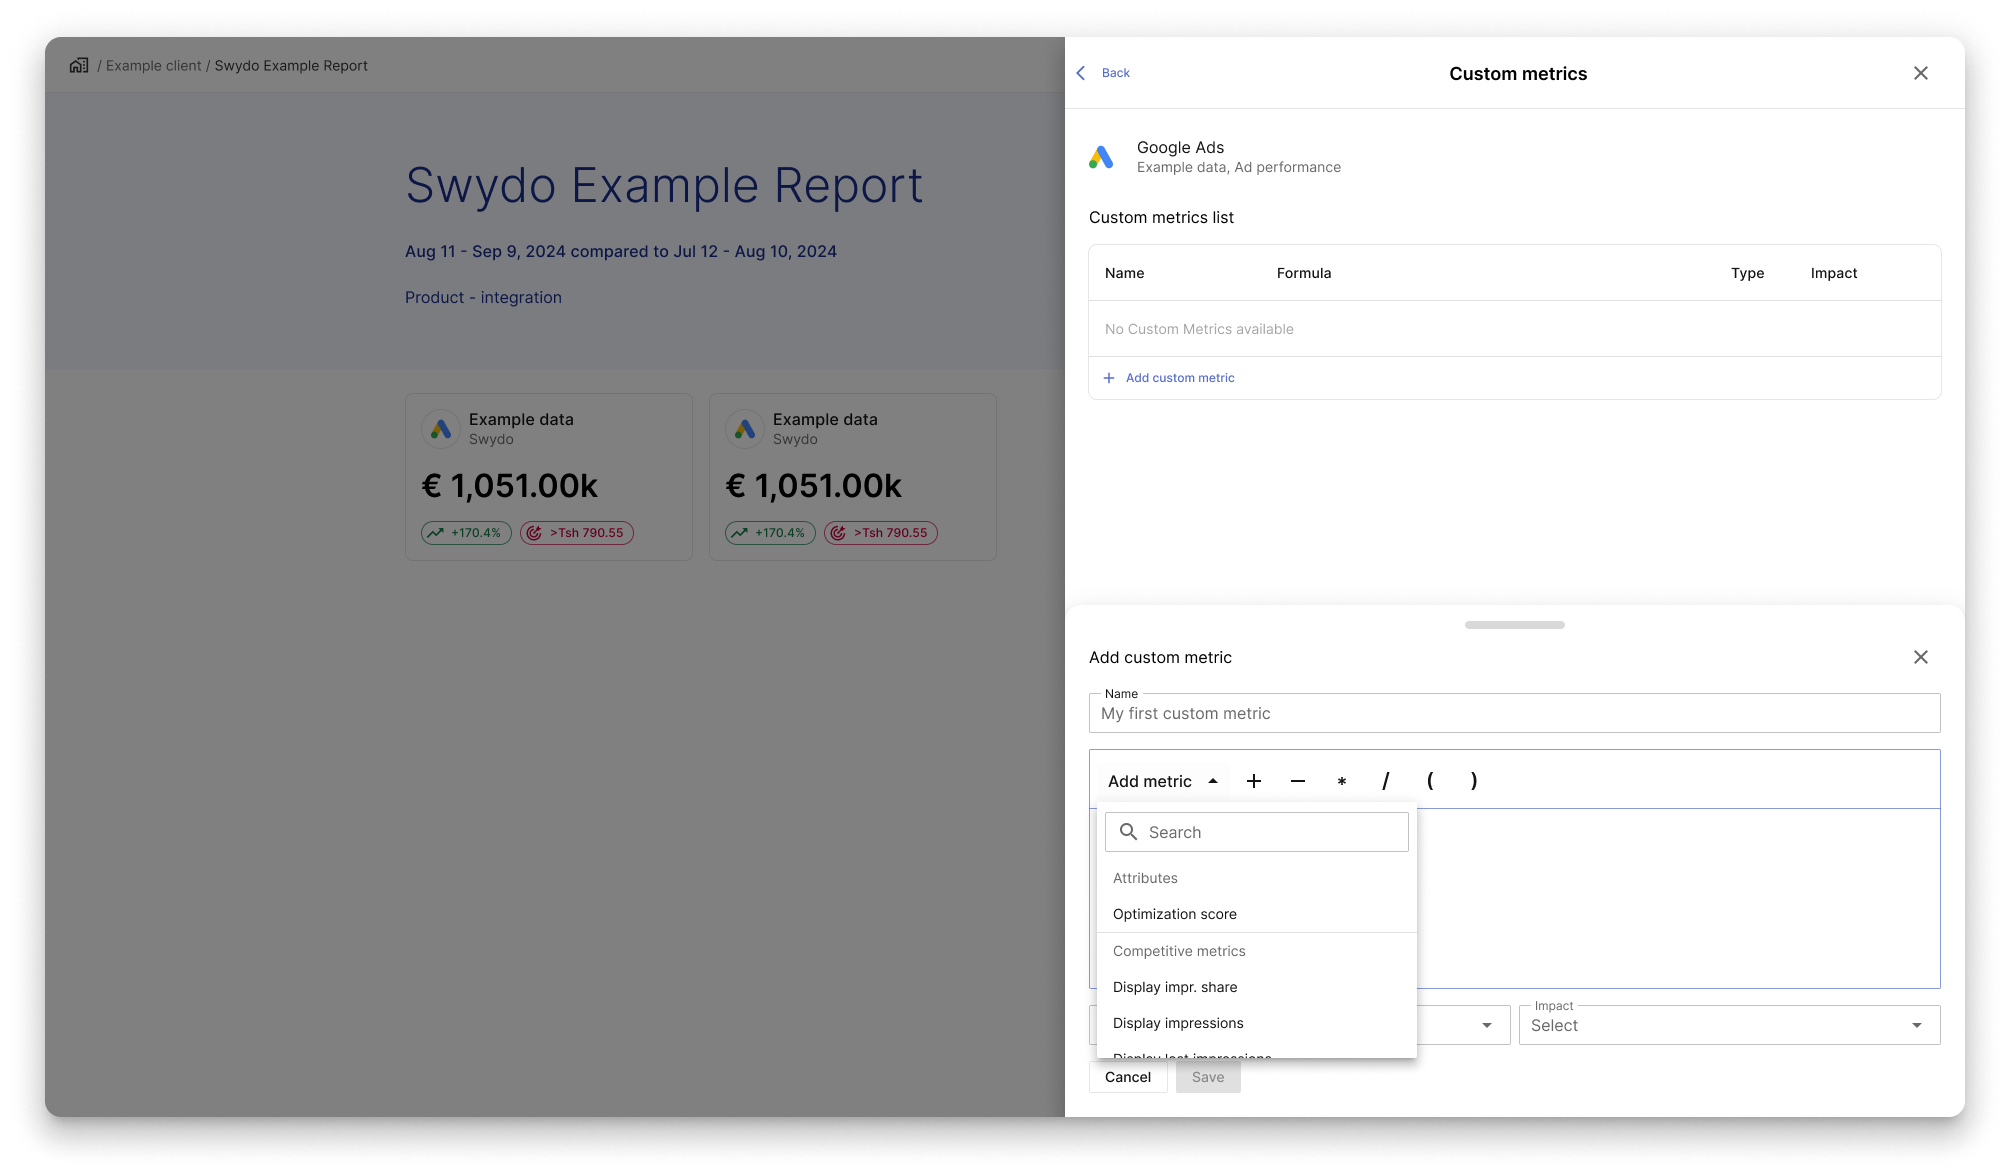
Users can either access the metrics list by clicking on the Add metric button
or by clicking directly in the formula field. For this showcase we only see the first option.
After clicking, a dropdown will appear showing available
metrics and a search input field to filter the available metrics.
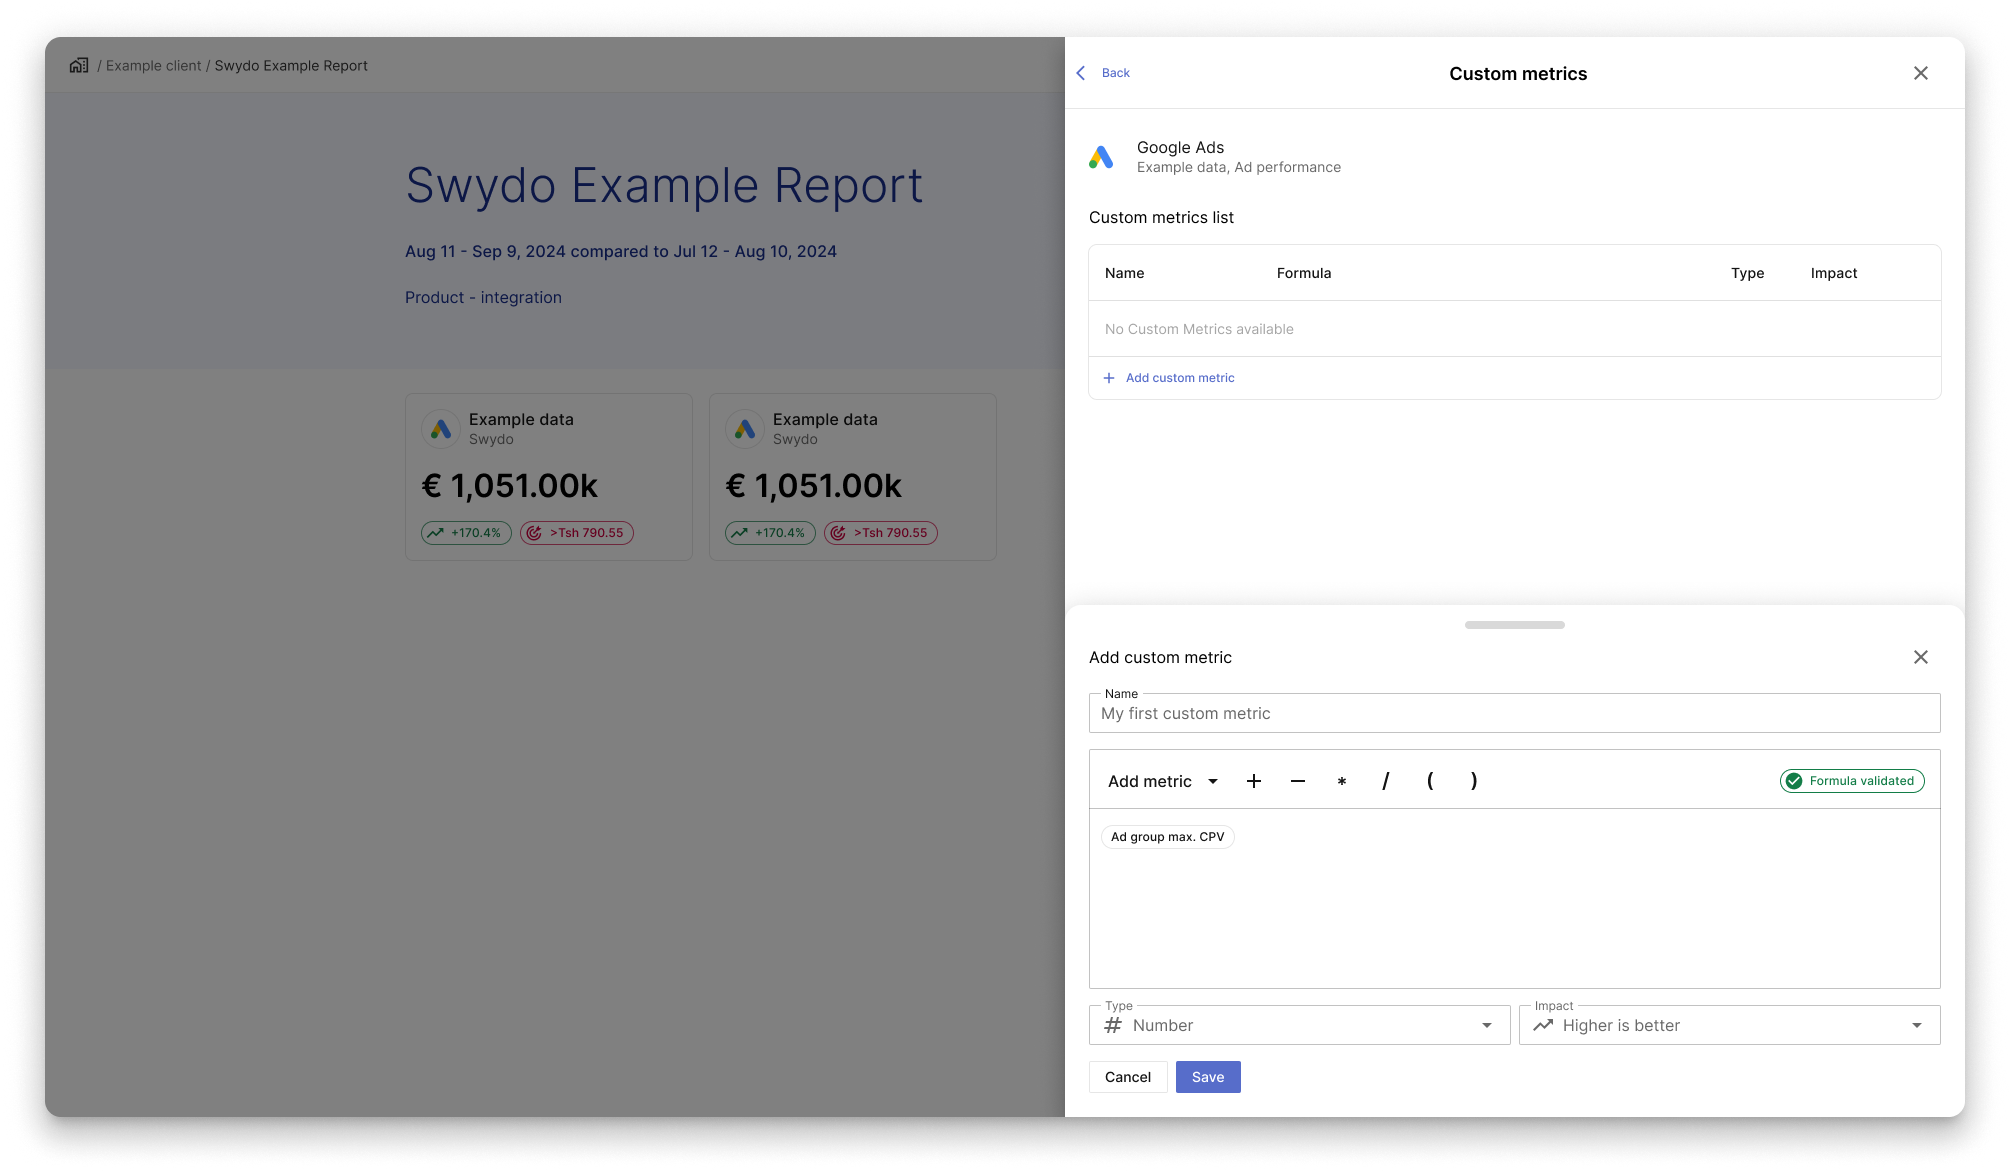
After selecting a metric, the dropdown closes, a validation chip appears,
the metric chip is added to the editor, Type and Impact
are auto-filled, and the Save button becomes active.
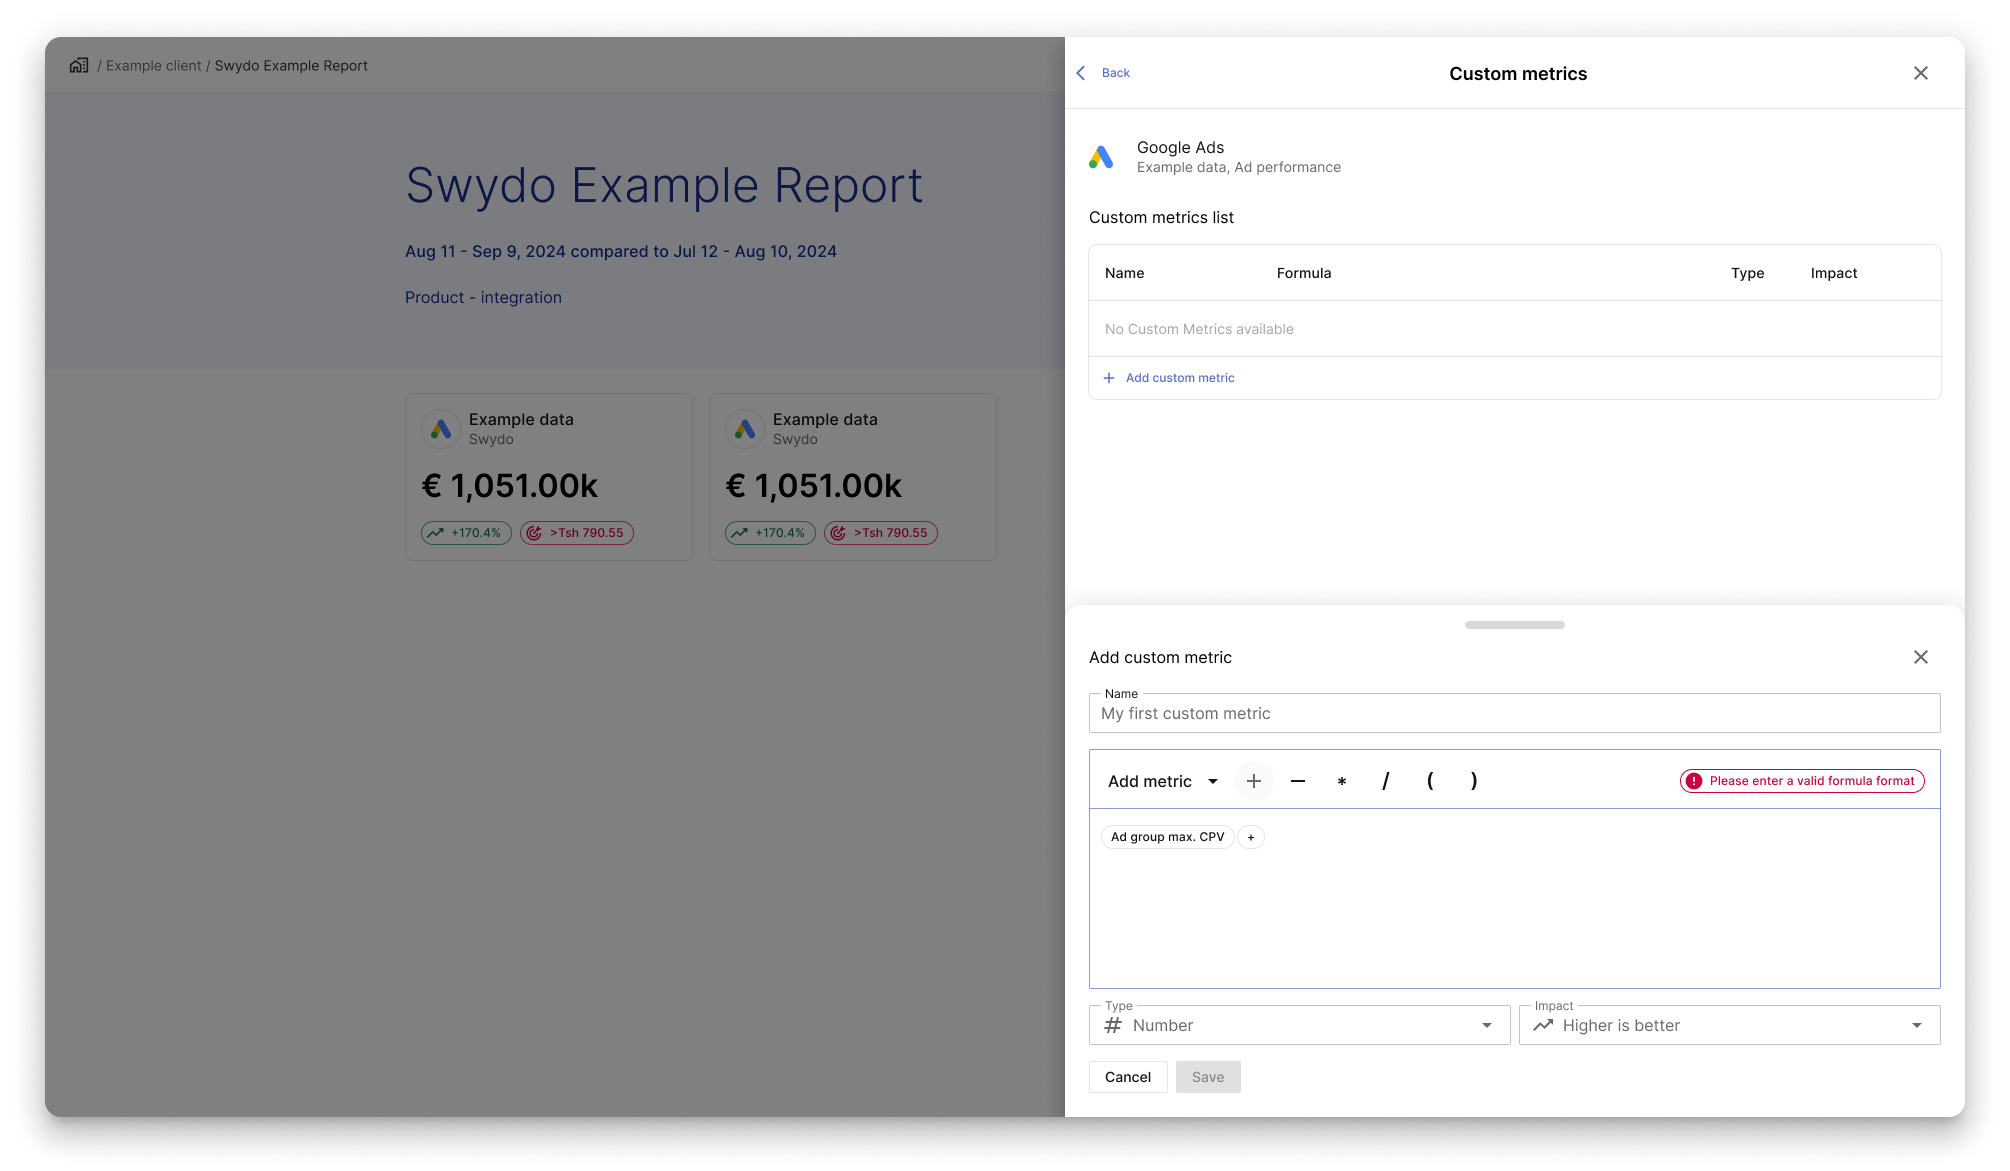
After adding the first metric, users can type or select operators from the menu.
Some icons are pending in the design system. Invalid formulas trigger error messages
and must end with a metric or closing parenthesis.
Saving is disabled until the formula is corrected.
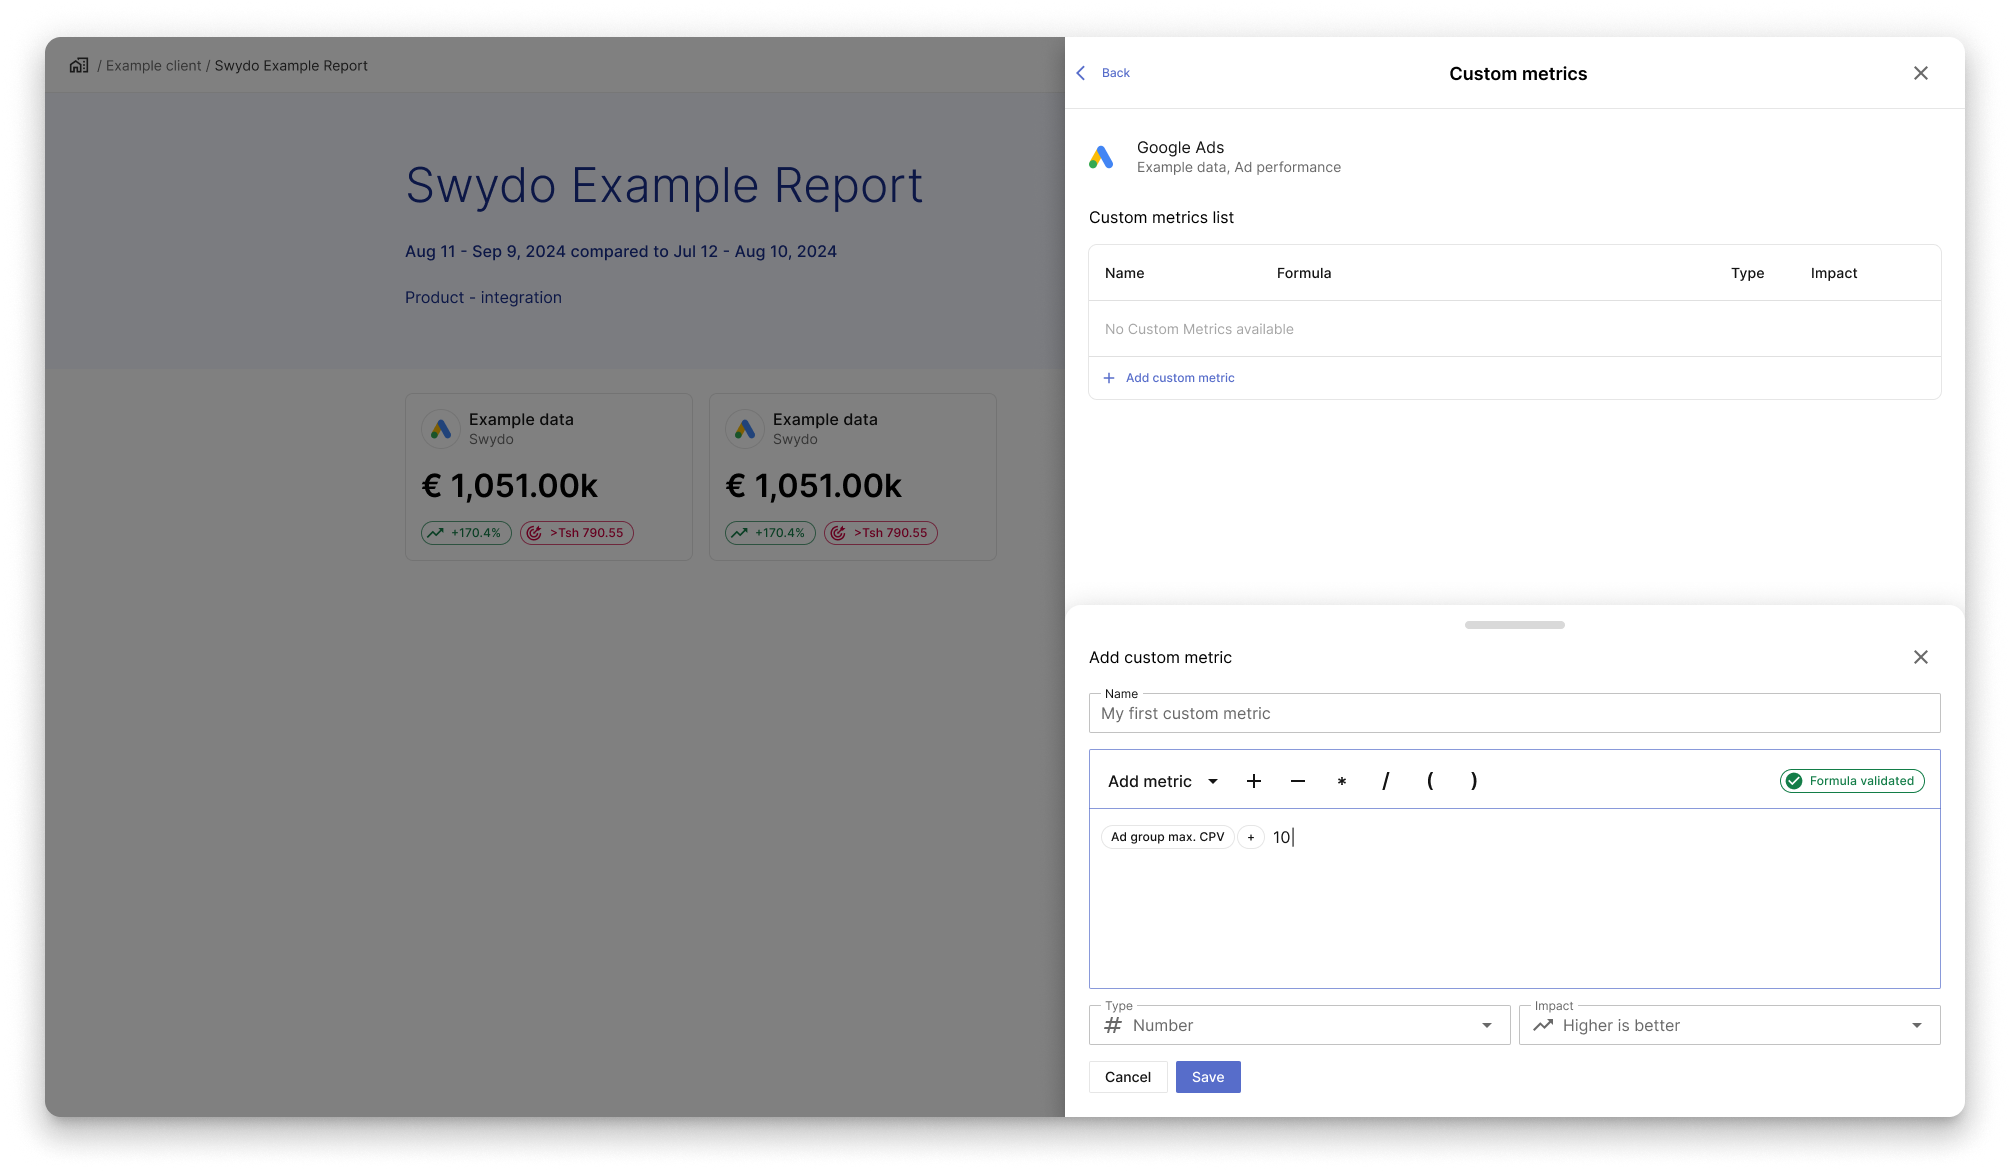
Users can type numbers directly into the input field. If the input doesn’t match a metric,
no dropdown appears. Pressing Enter converts the number into a chip.
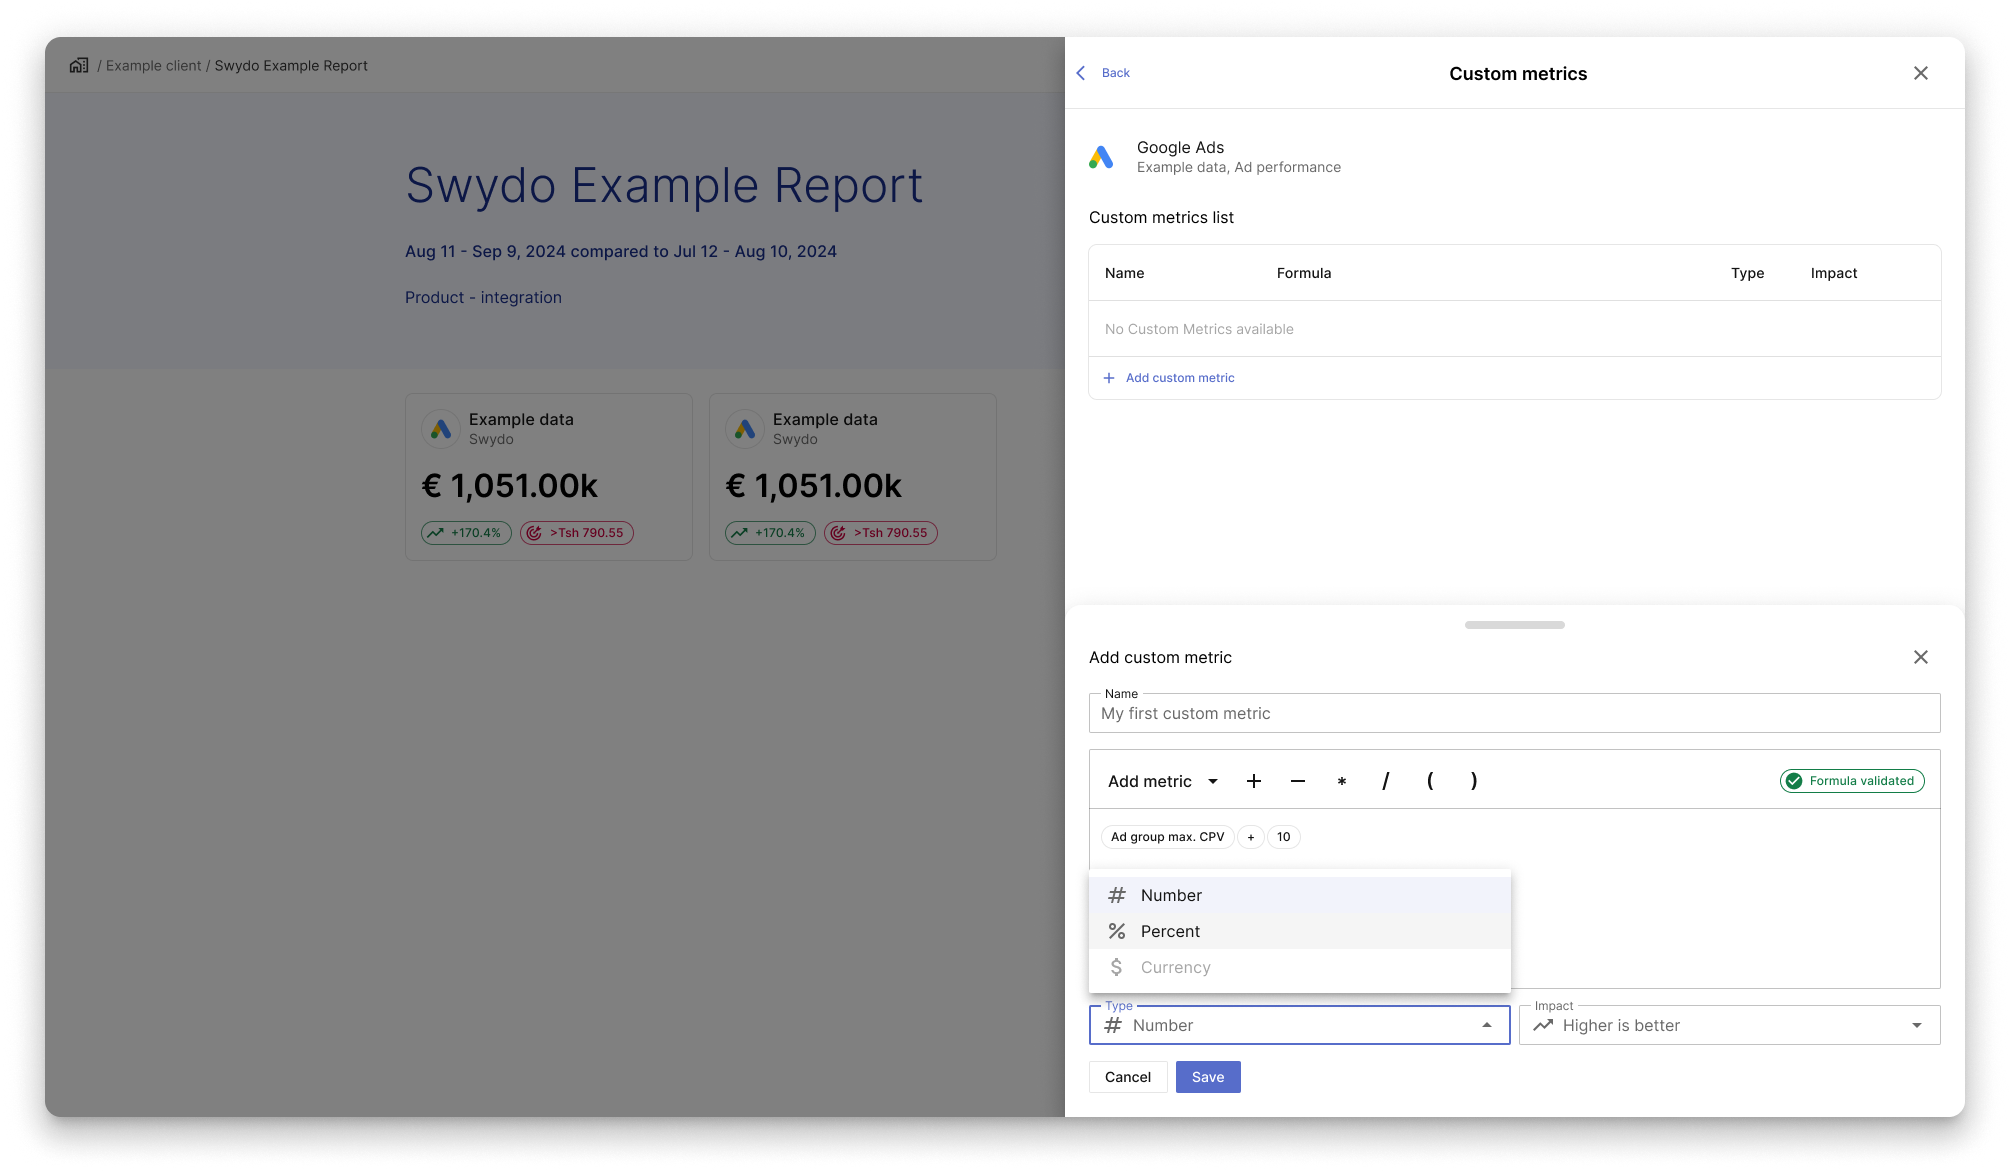
Once the formula is complete, a validation message appears.
If the formula includes two metrics, users can manually select
the Type from a limited set of valid options.
For single metrics, Type is auto-assigned.
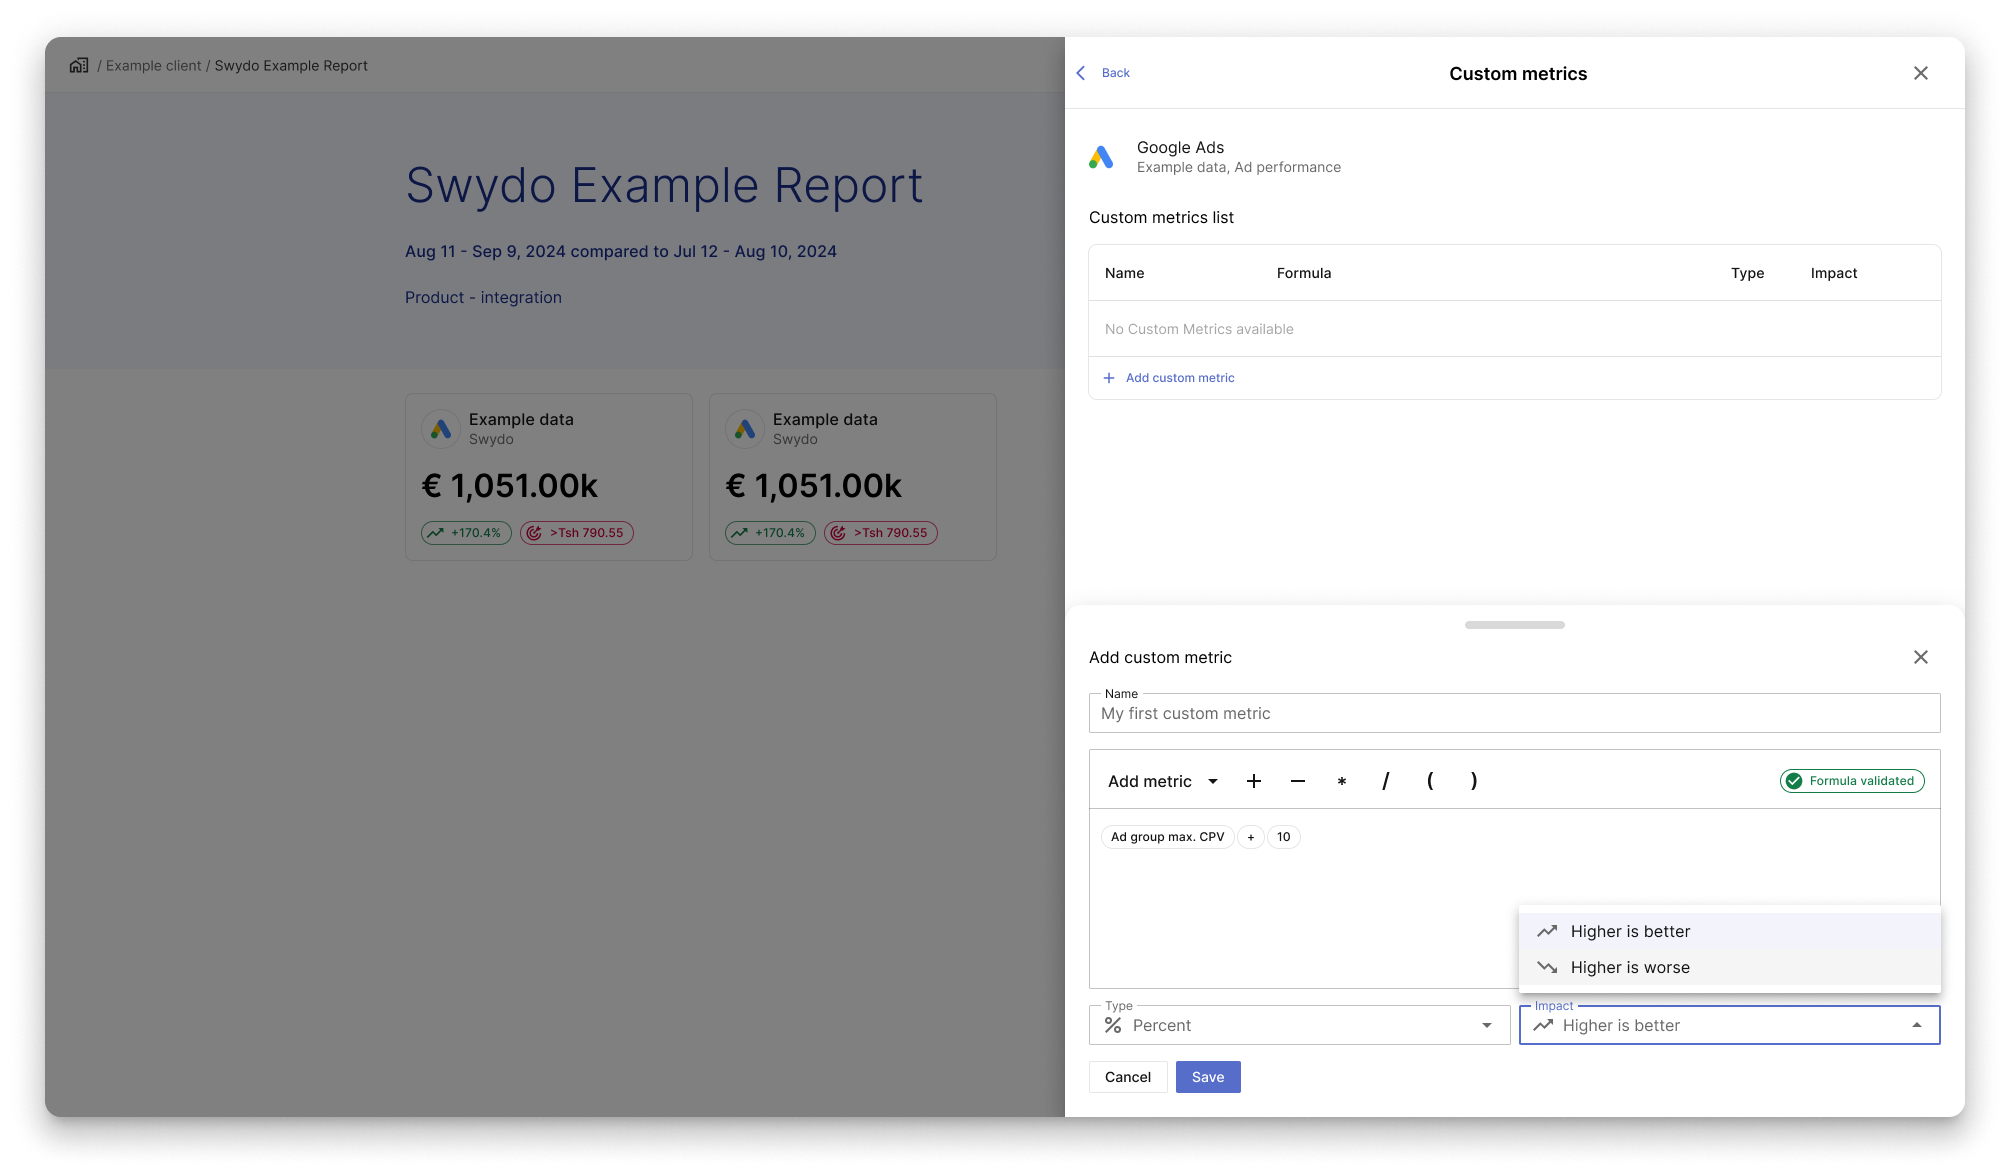
Impact is now set directly within the formula editor, instead of in the table row.
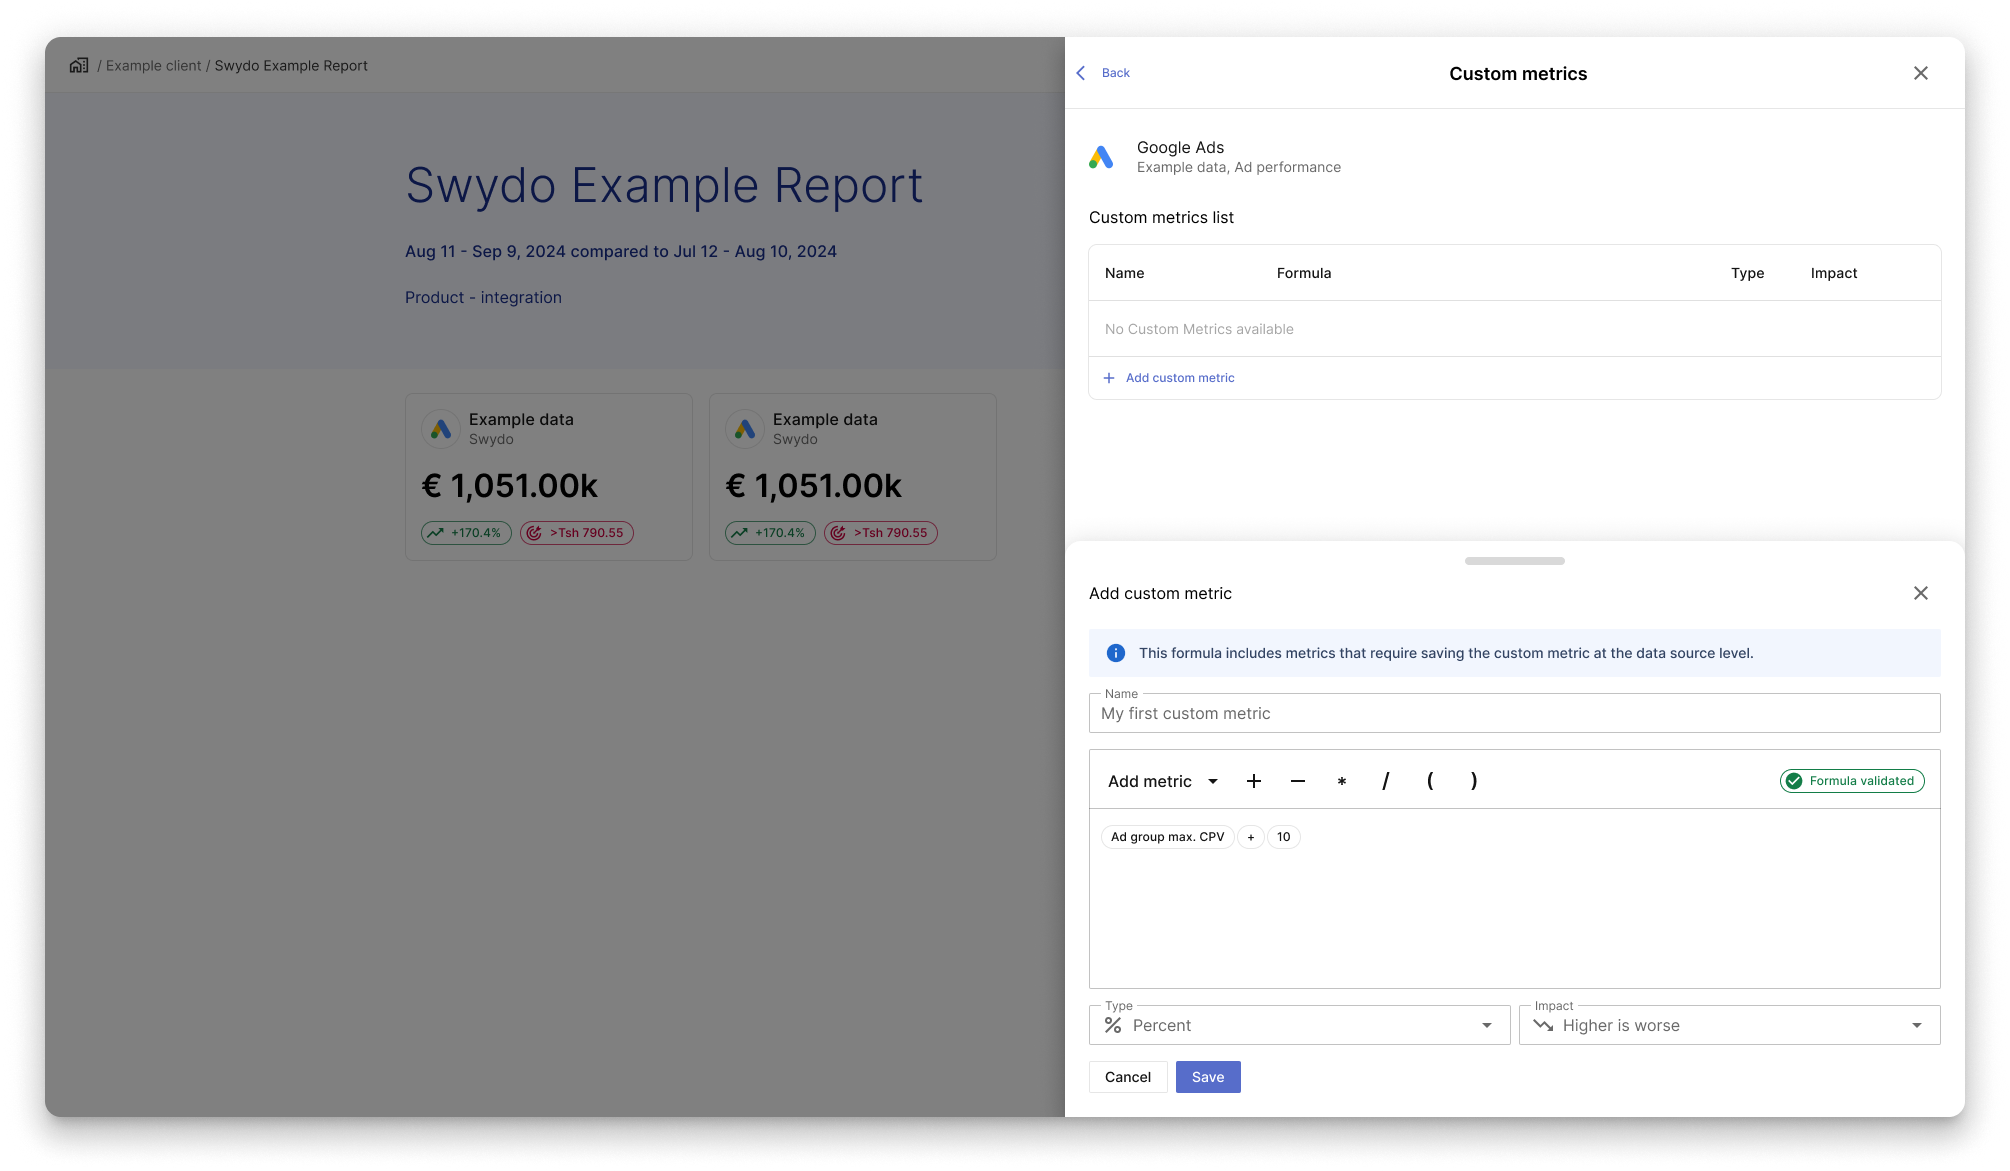
If a custom metric includes dynamic metrics, it’s saved at the data source level.
A message appears above the input field to inform the user of this condition.
Overview of the custom metrics in the new table
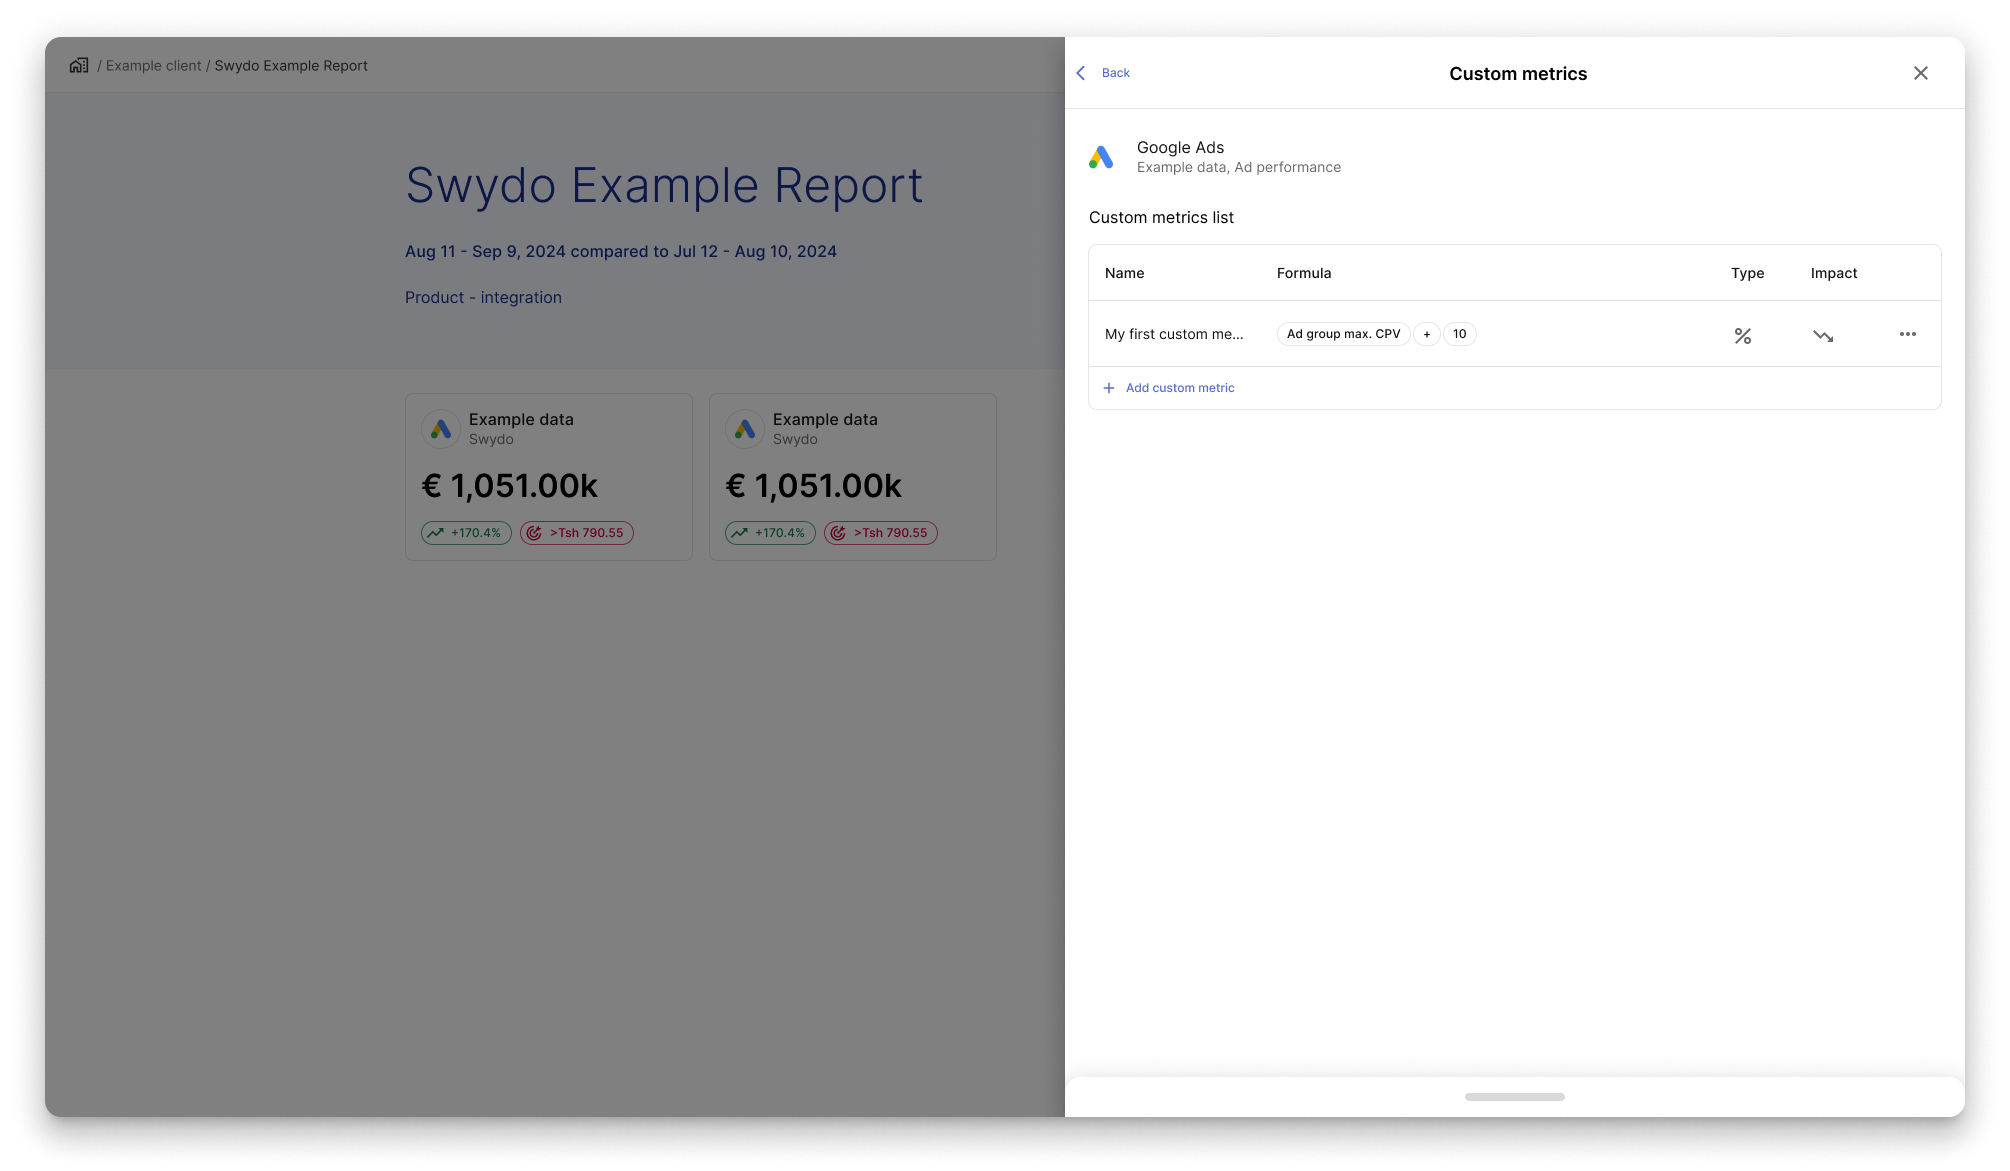
Once users save their new custom metric, they can see it in the table.
From this overview they will only be able to read information.
To edit them, click on the three dots and select edit.
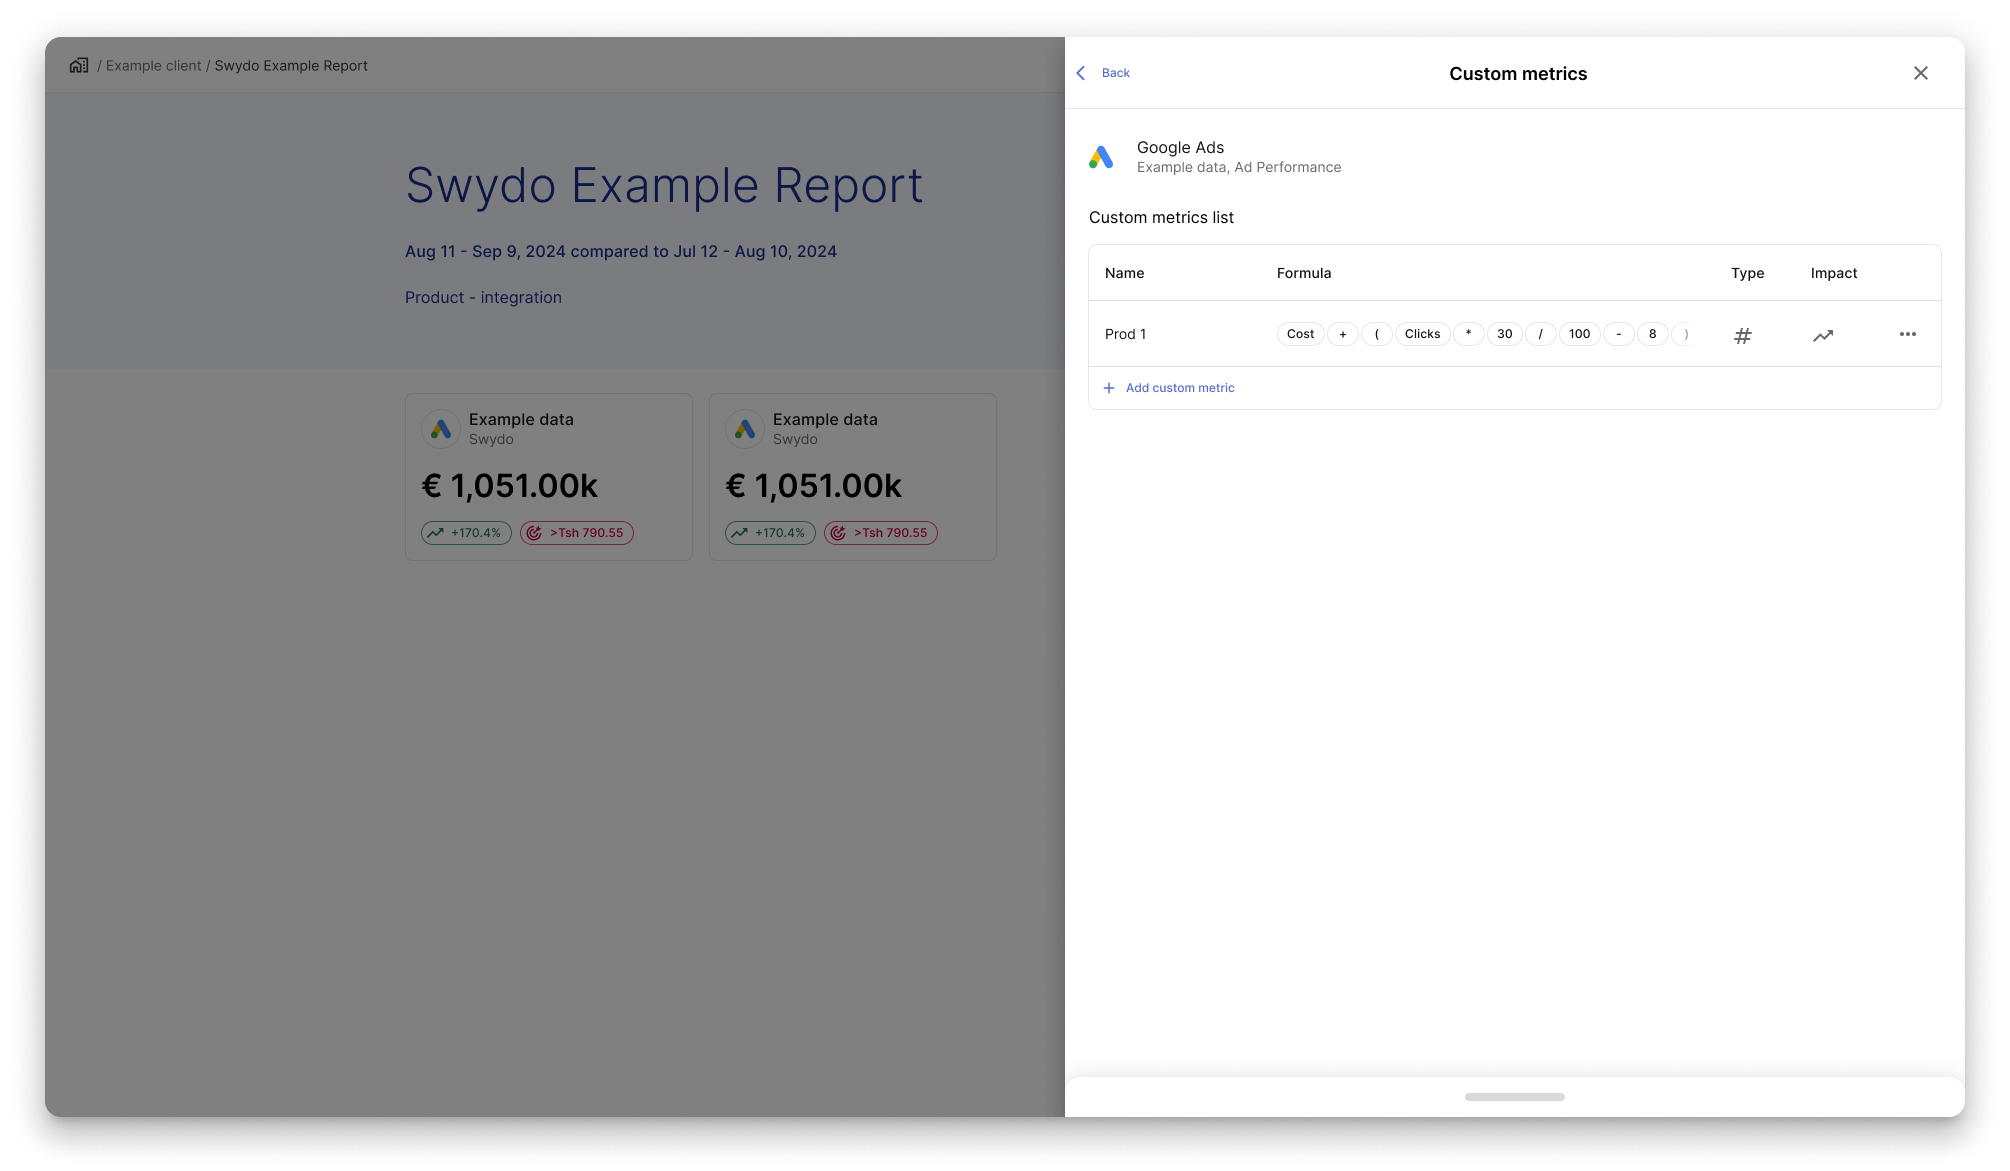
Users might create very long formulas in each row cell,
this means that part of it might be partly hidden.
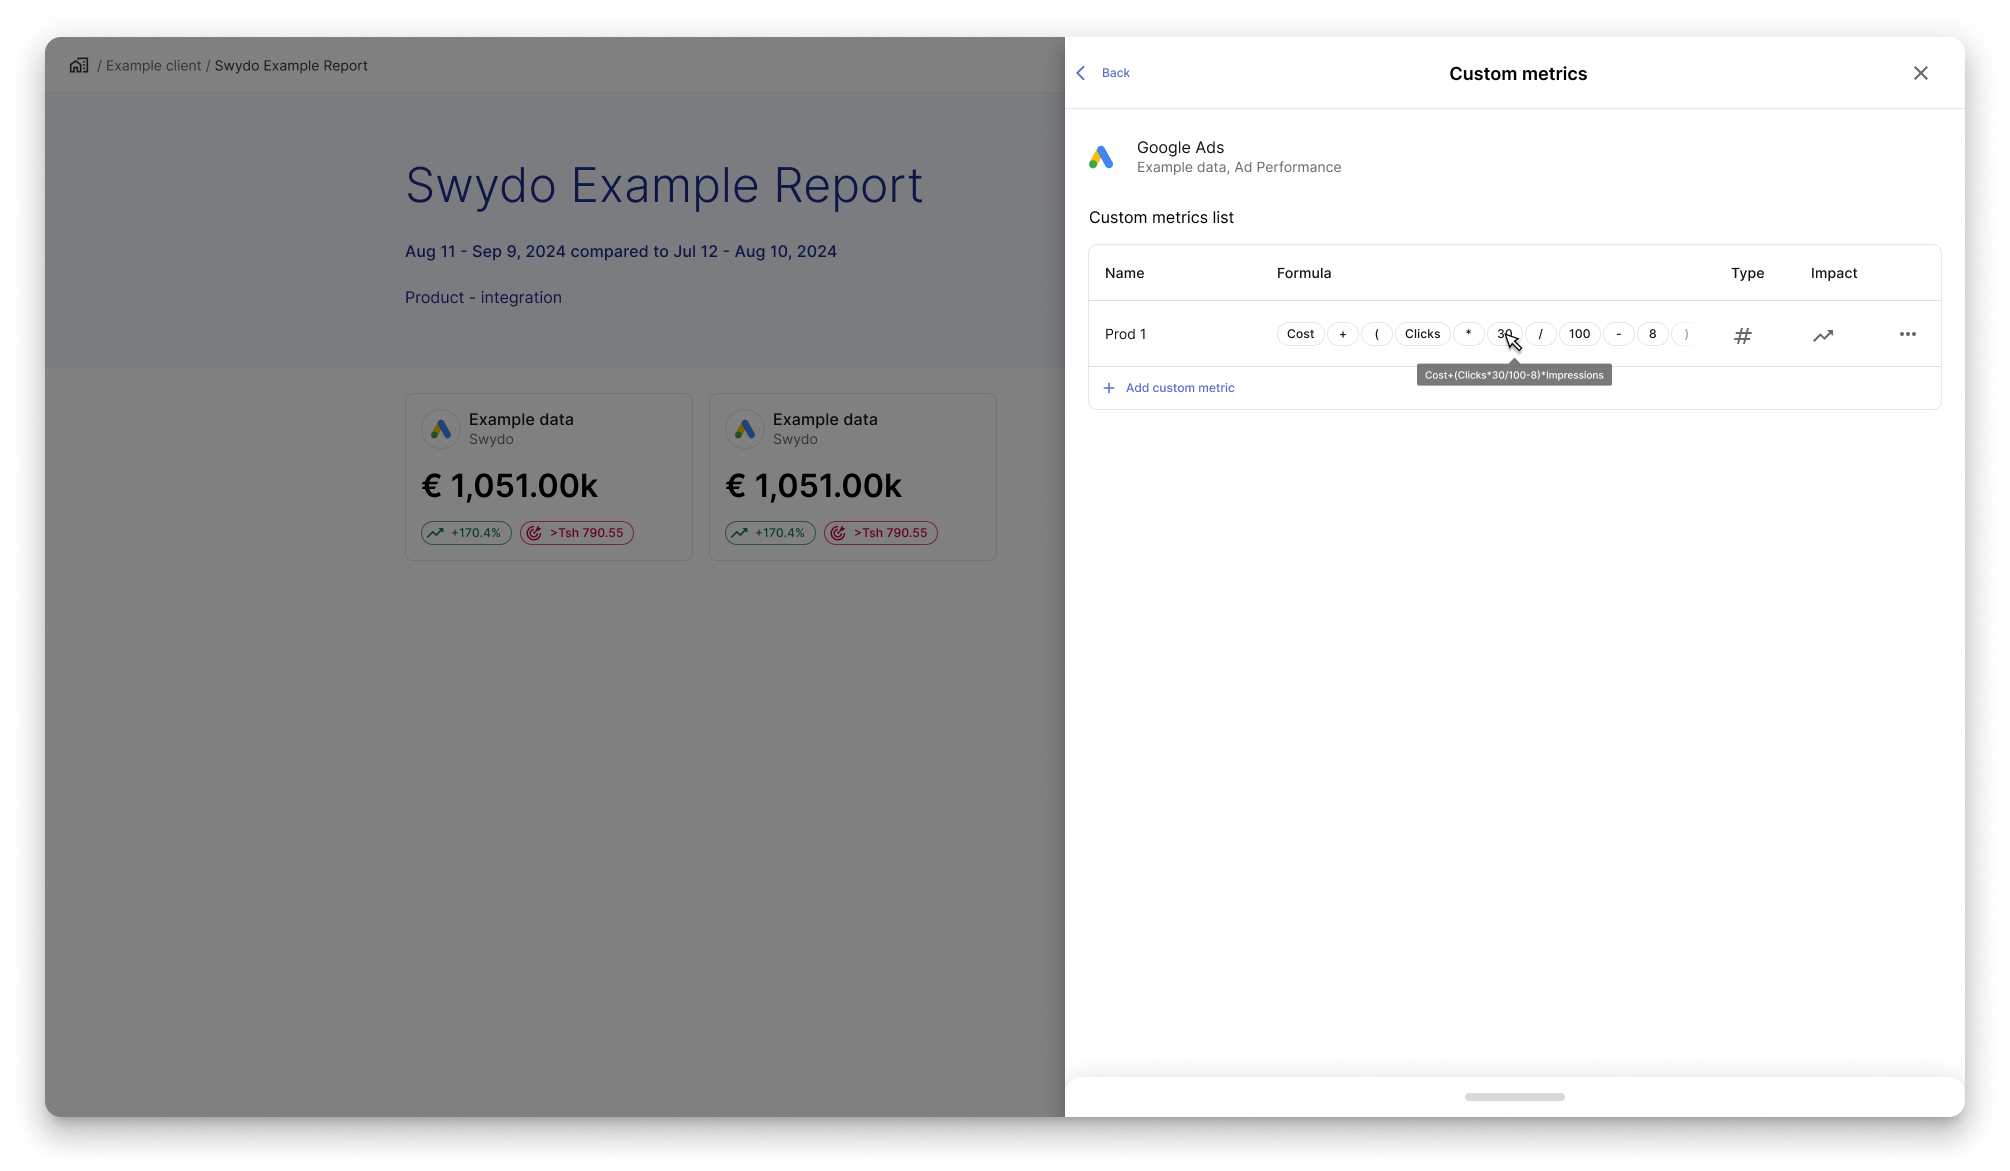
If users go over the formula with their mouse,
they will be able to see a tooltip that will sum up the entire formula.
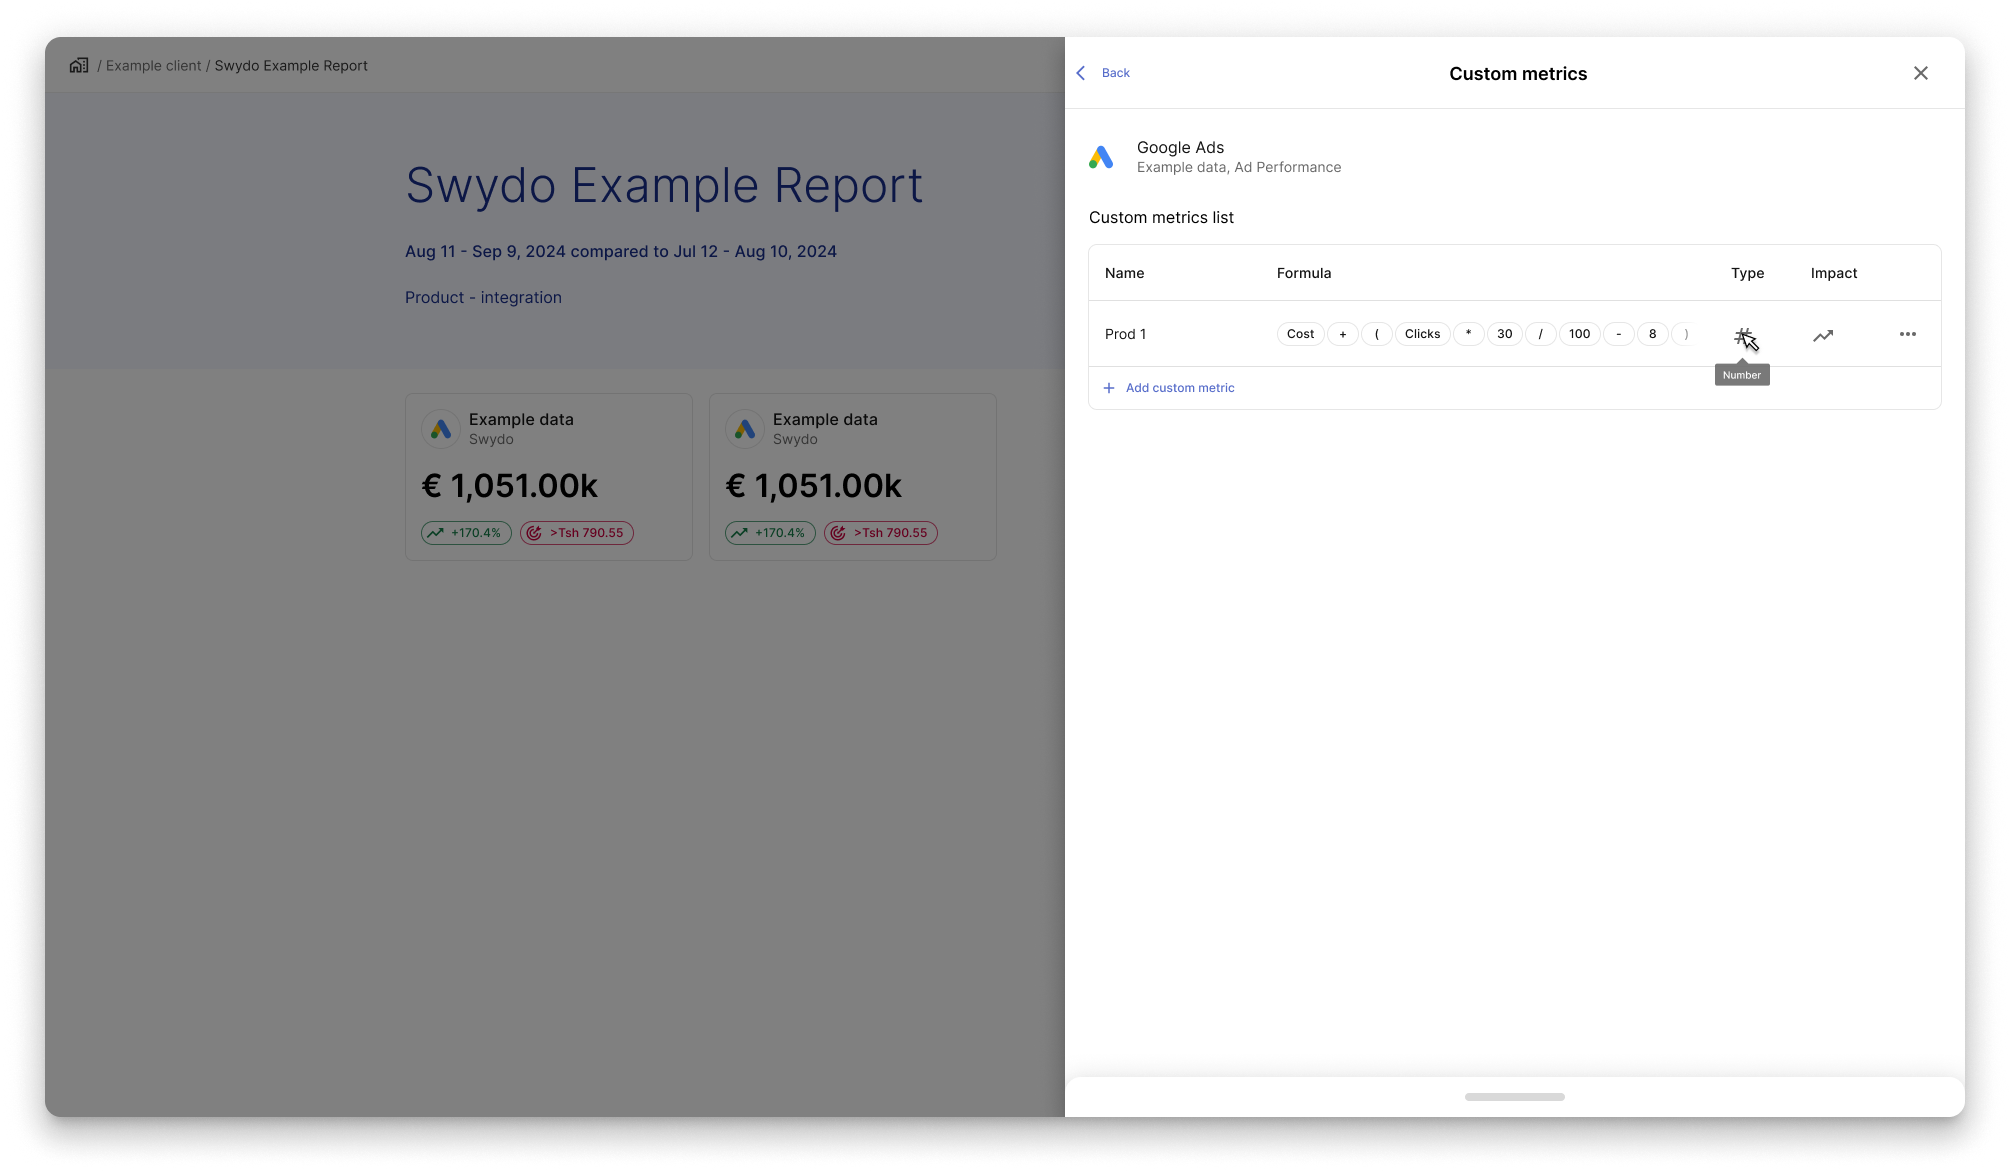
Since now the type has become an icon, users who aren’t familiar with the element
can hover it and get a tooltip that will explain what kind of type it is.
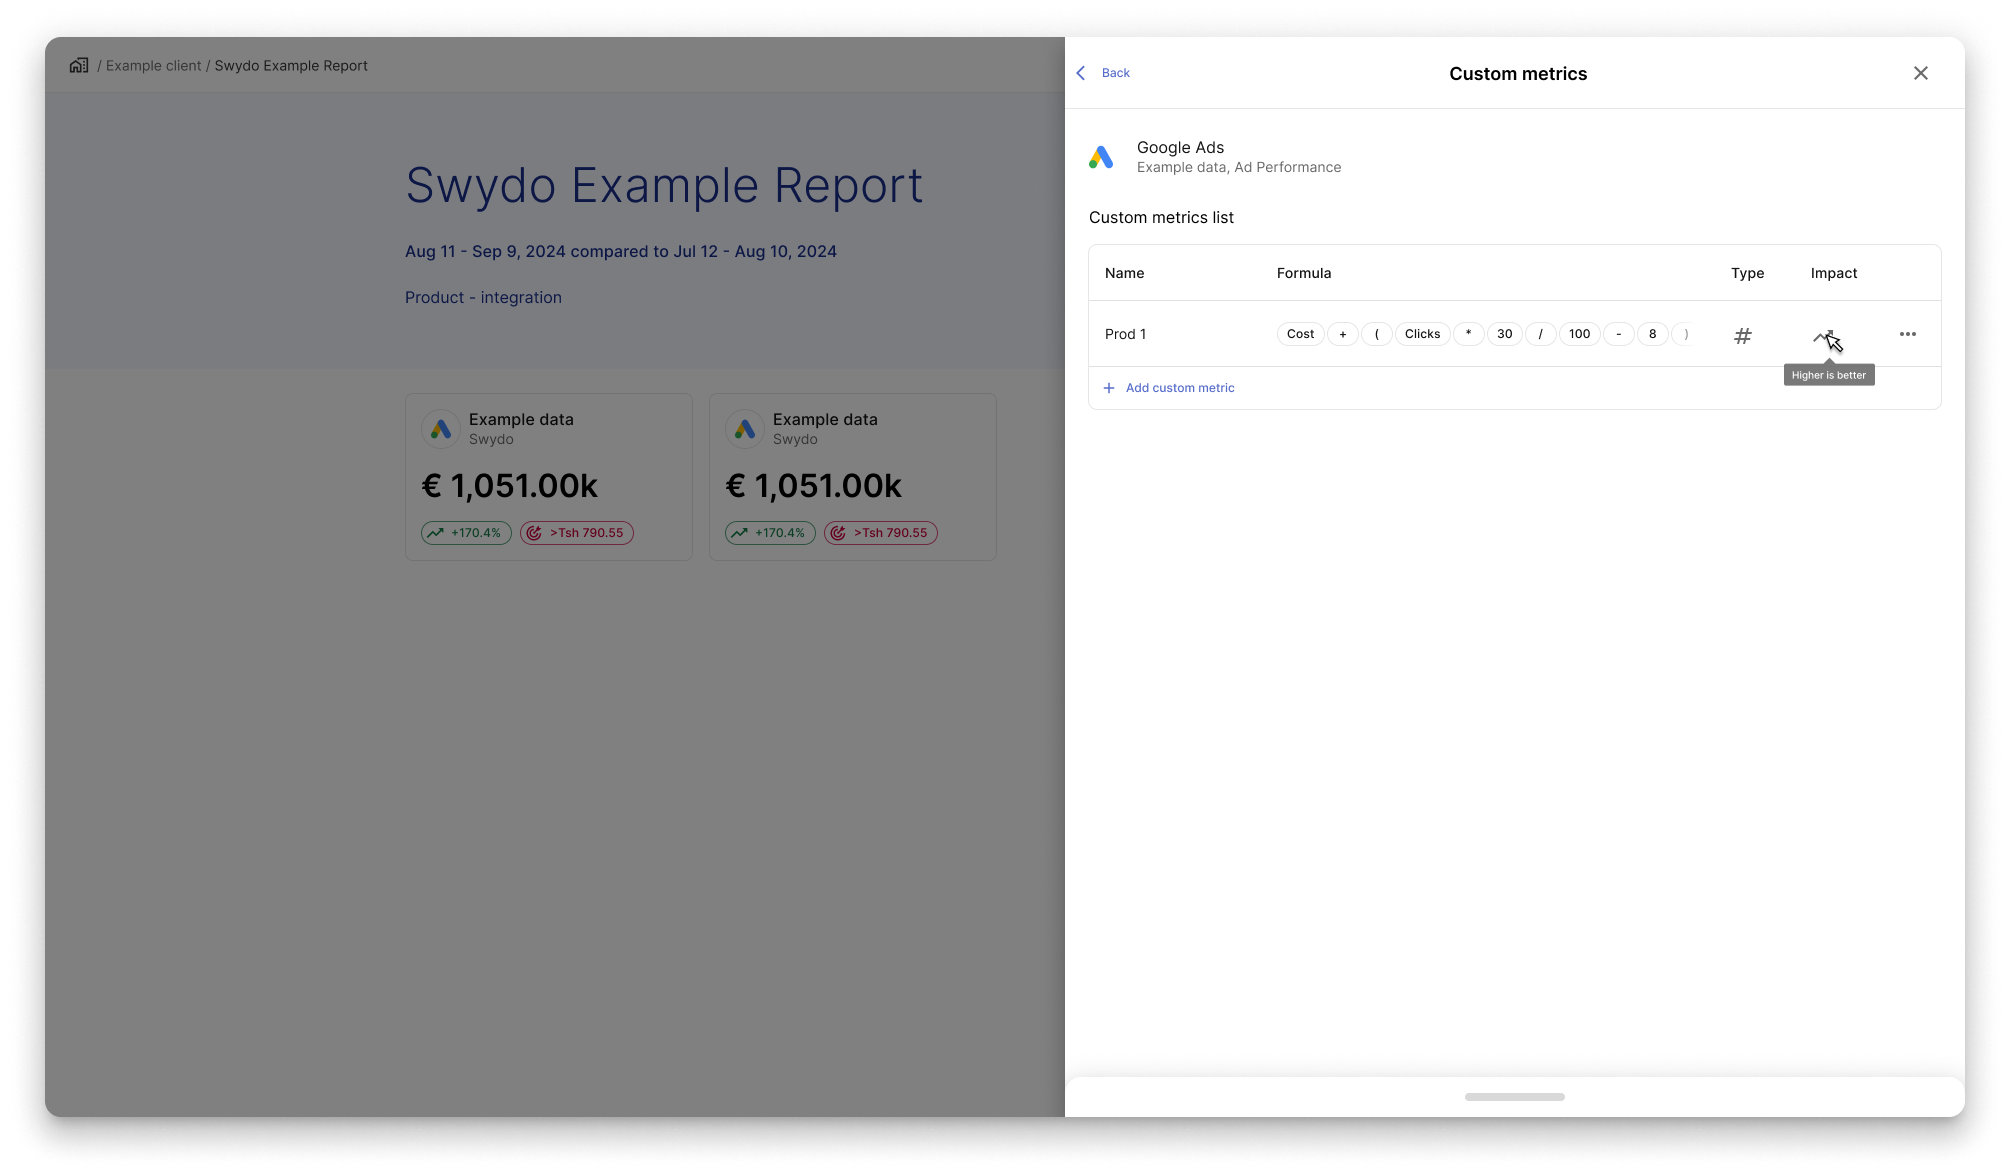
Since now Impact (former Comparison Change) has become an icon,
users who aren’t familiar with the element can hover over it
and get a tooltip that explains the type.
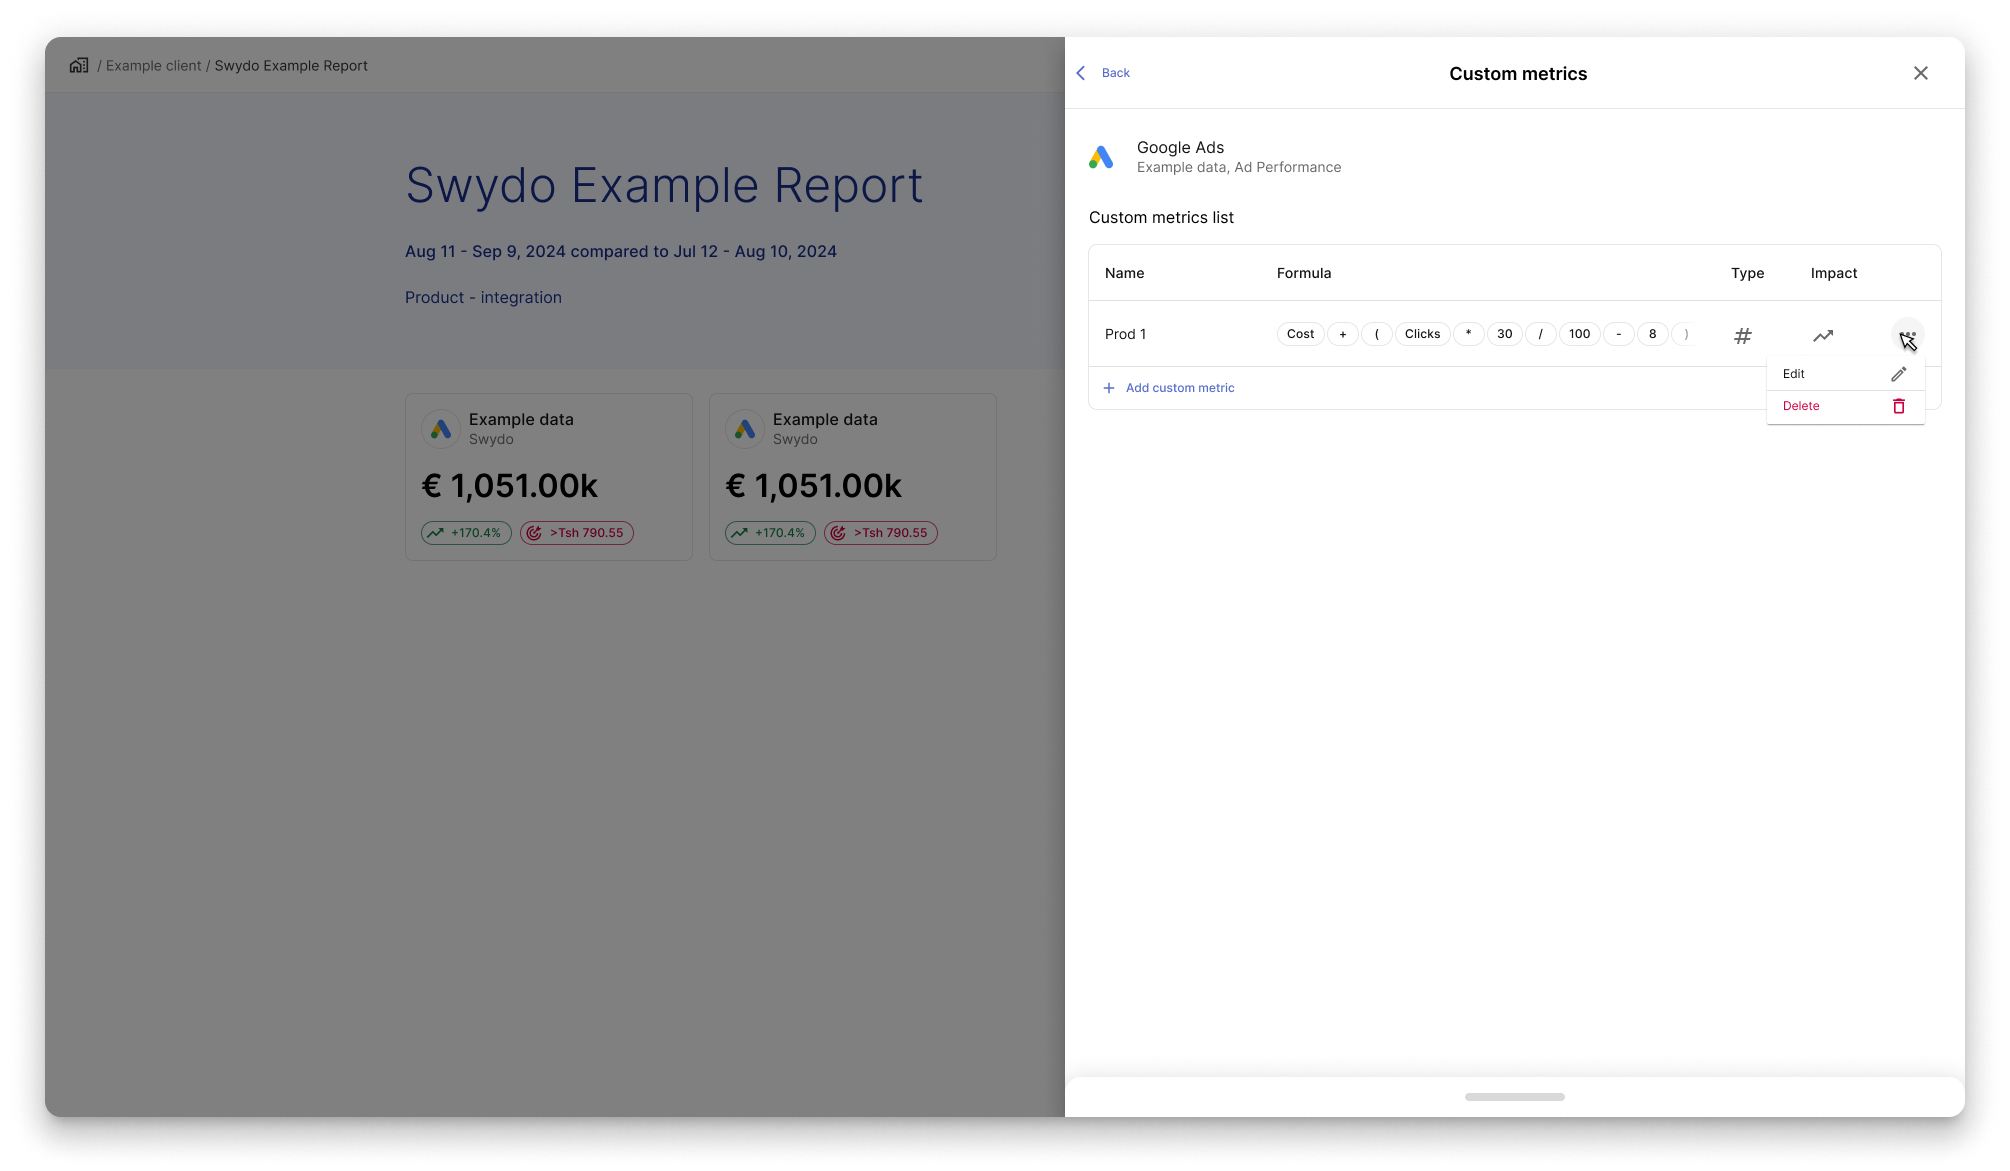
Clicking the three-dots icon opens a menu with two options:
Edit to modify the custom metric, and Delete to remove it from the list.
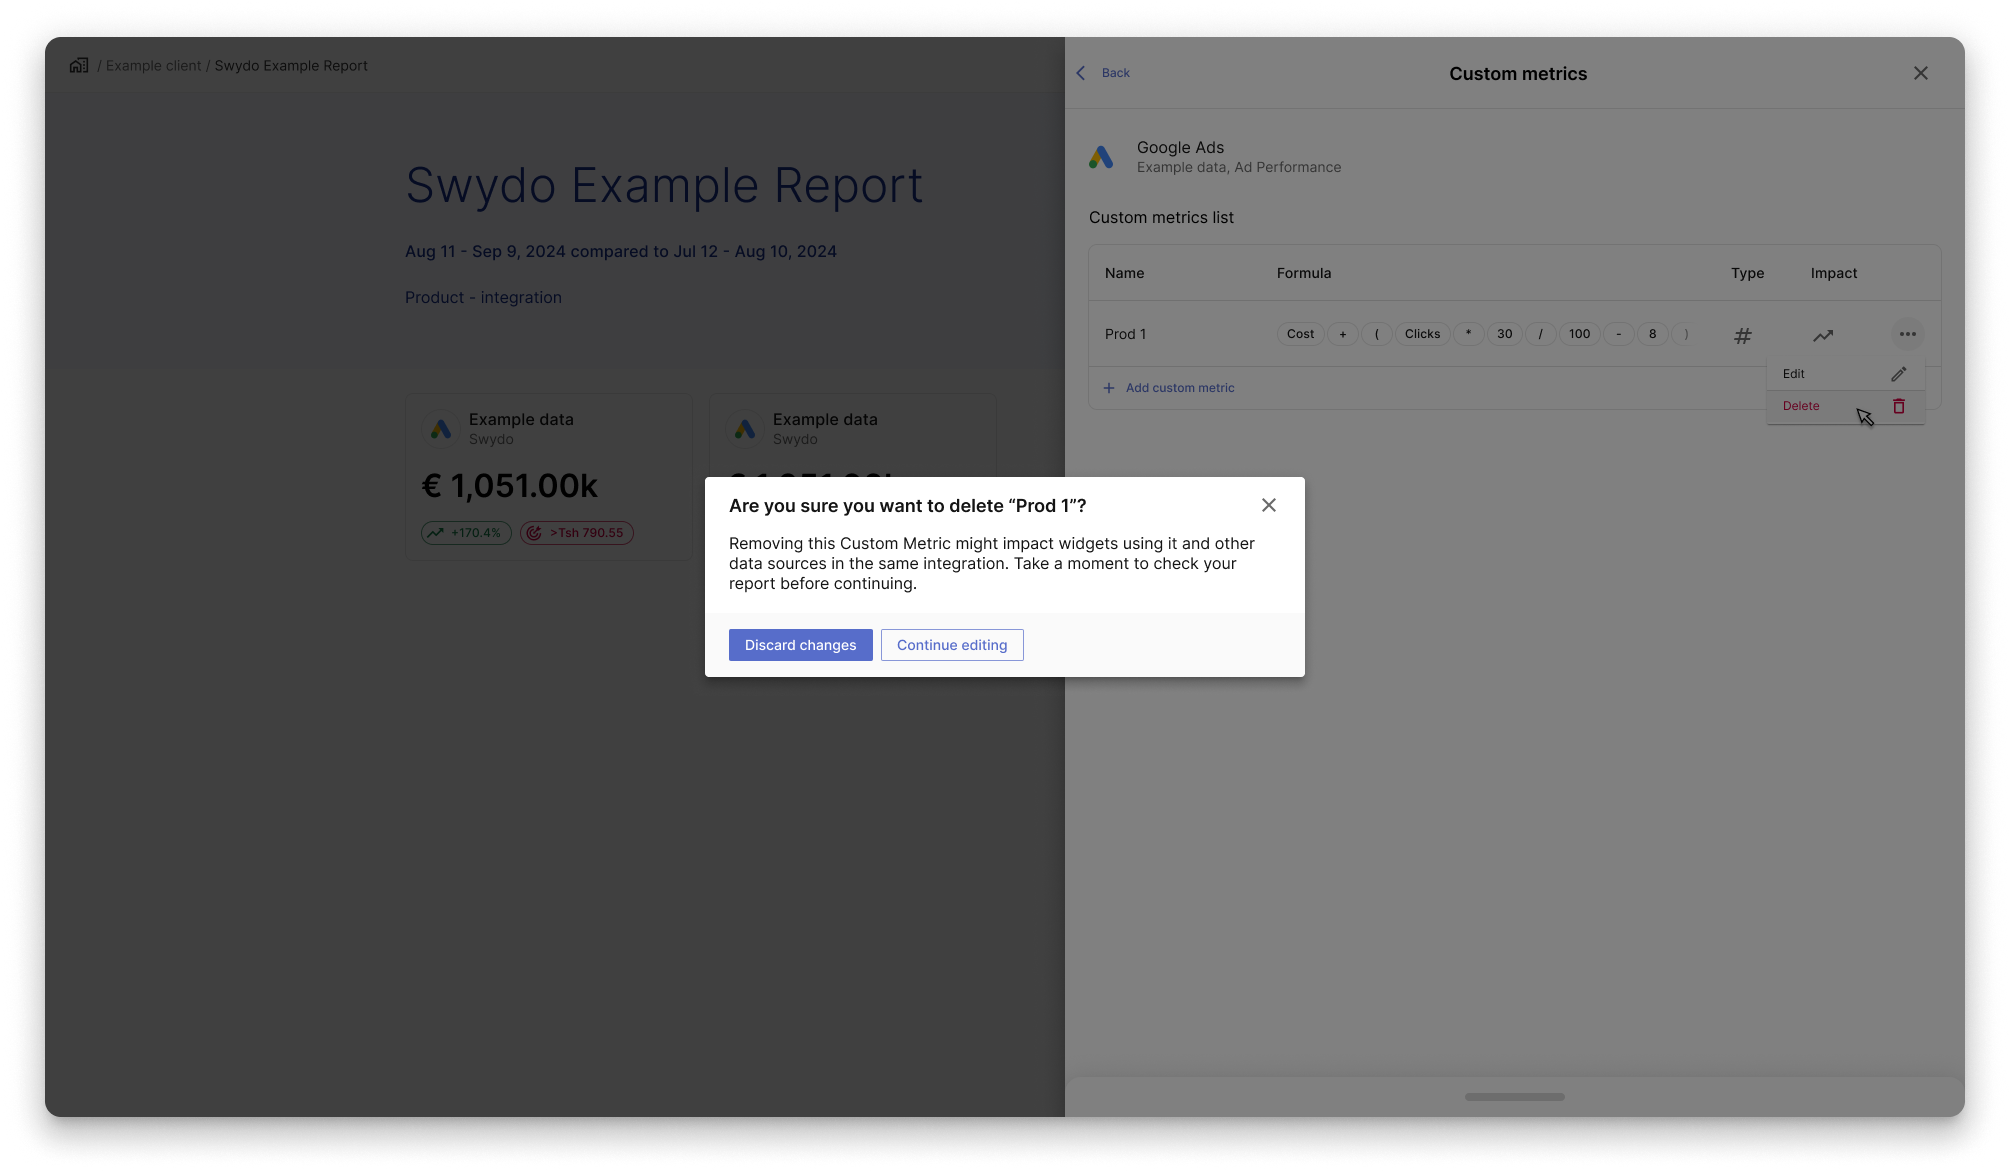
To delete a custom metric, users click the three-dots menu,
select Delete, and confirm the action in a standard pop-up dialog.
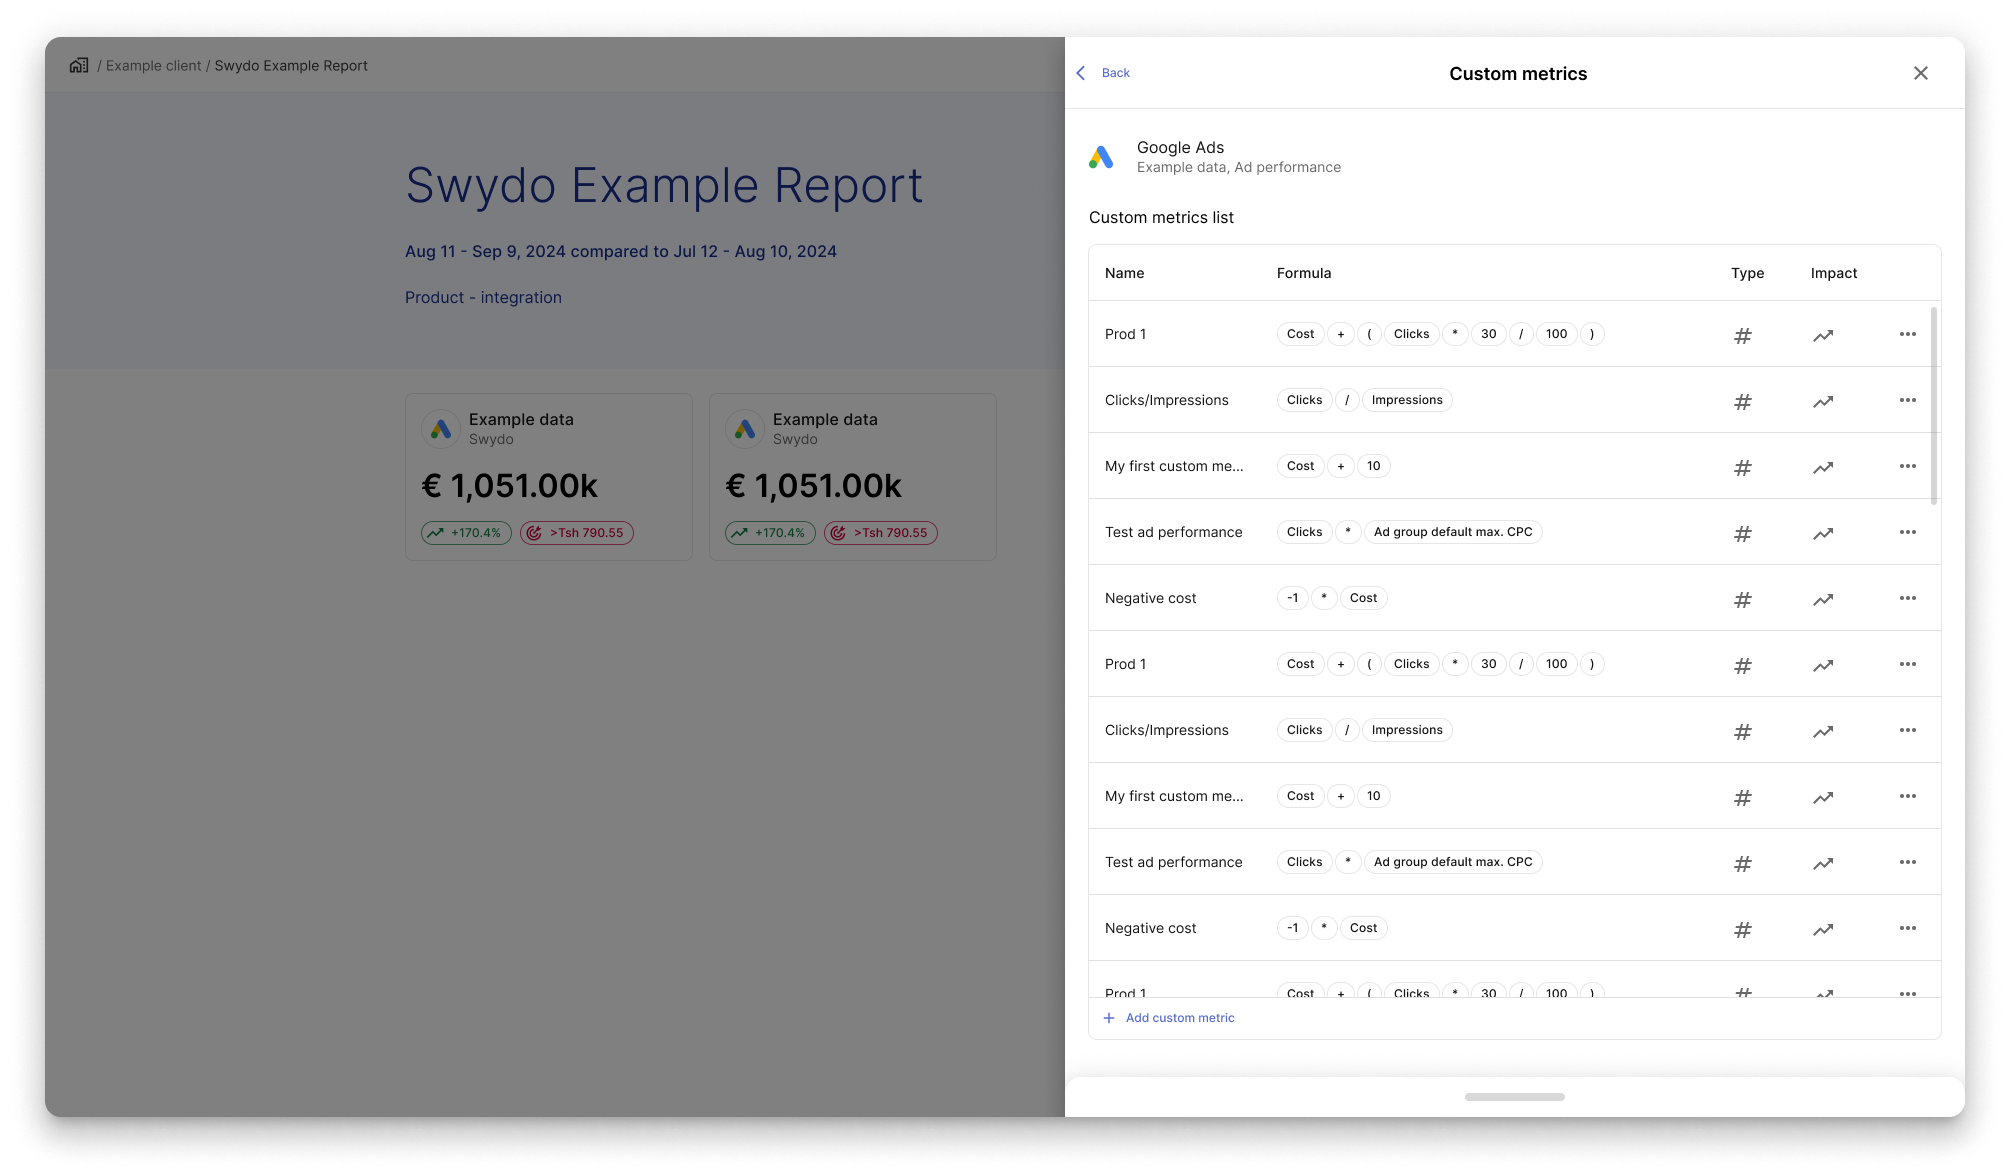
When the amount of custom metric rows exceeds the max-height
of the table list, the behaviour of the list content becomes scrollable.
Users will be able to scroll inside the list to reach the desired custom metric.
This choice wants to keep the list in place and leave
the add custom metrics button always visible.
Apply new custom metric to widget
When the users search through the available metrics, they can find
the custom metrics in the dropdown appearing below the custom metric select.
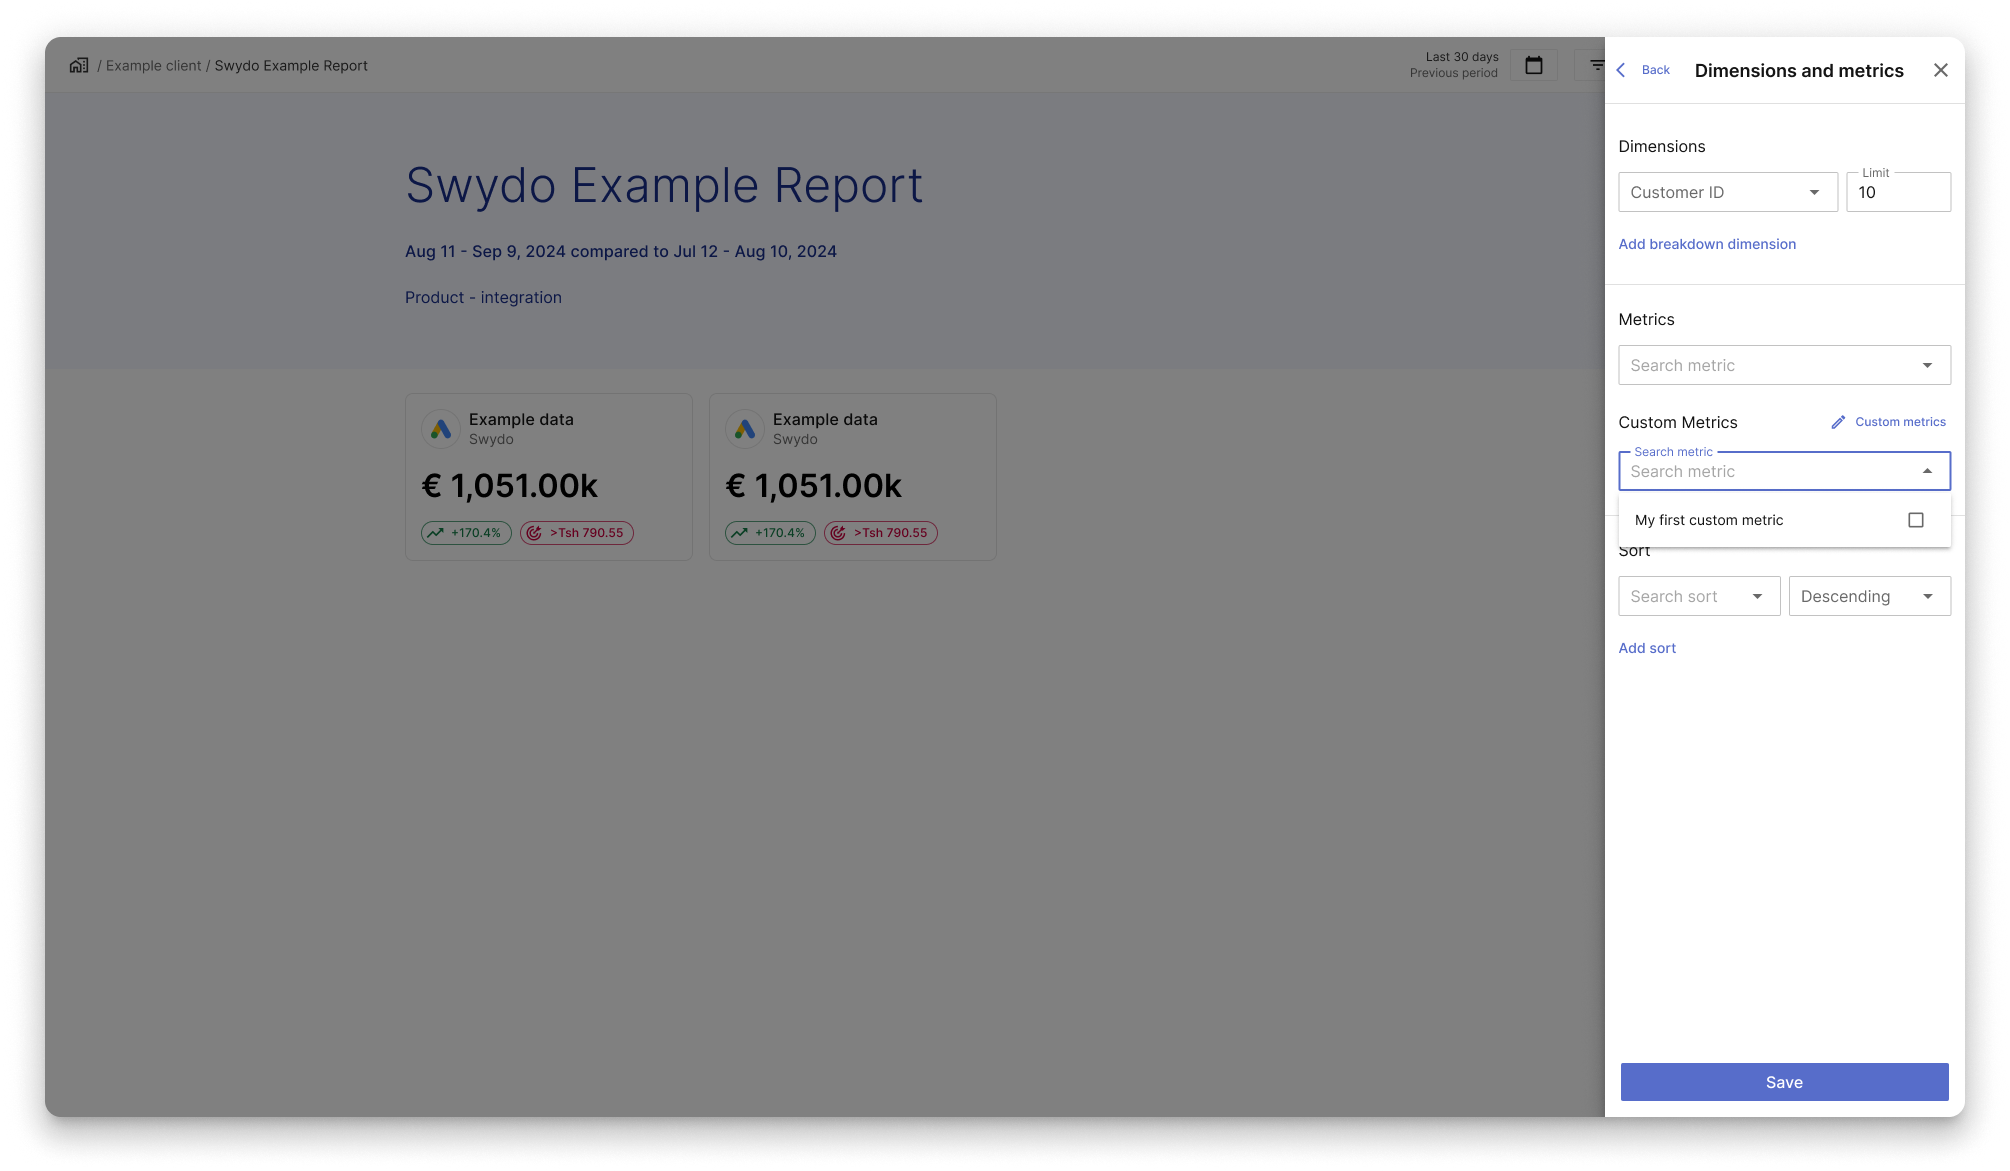
When searching, users can find available Custom Metrics
in the dropdown below the Custom Metric select.
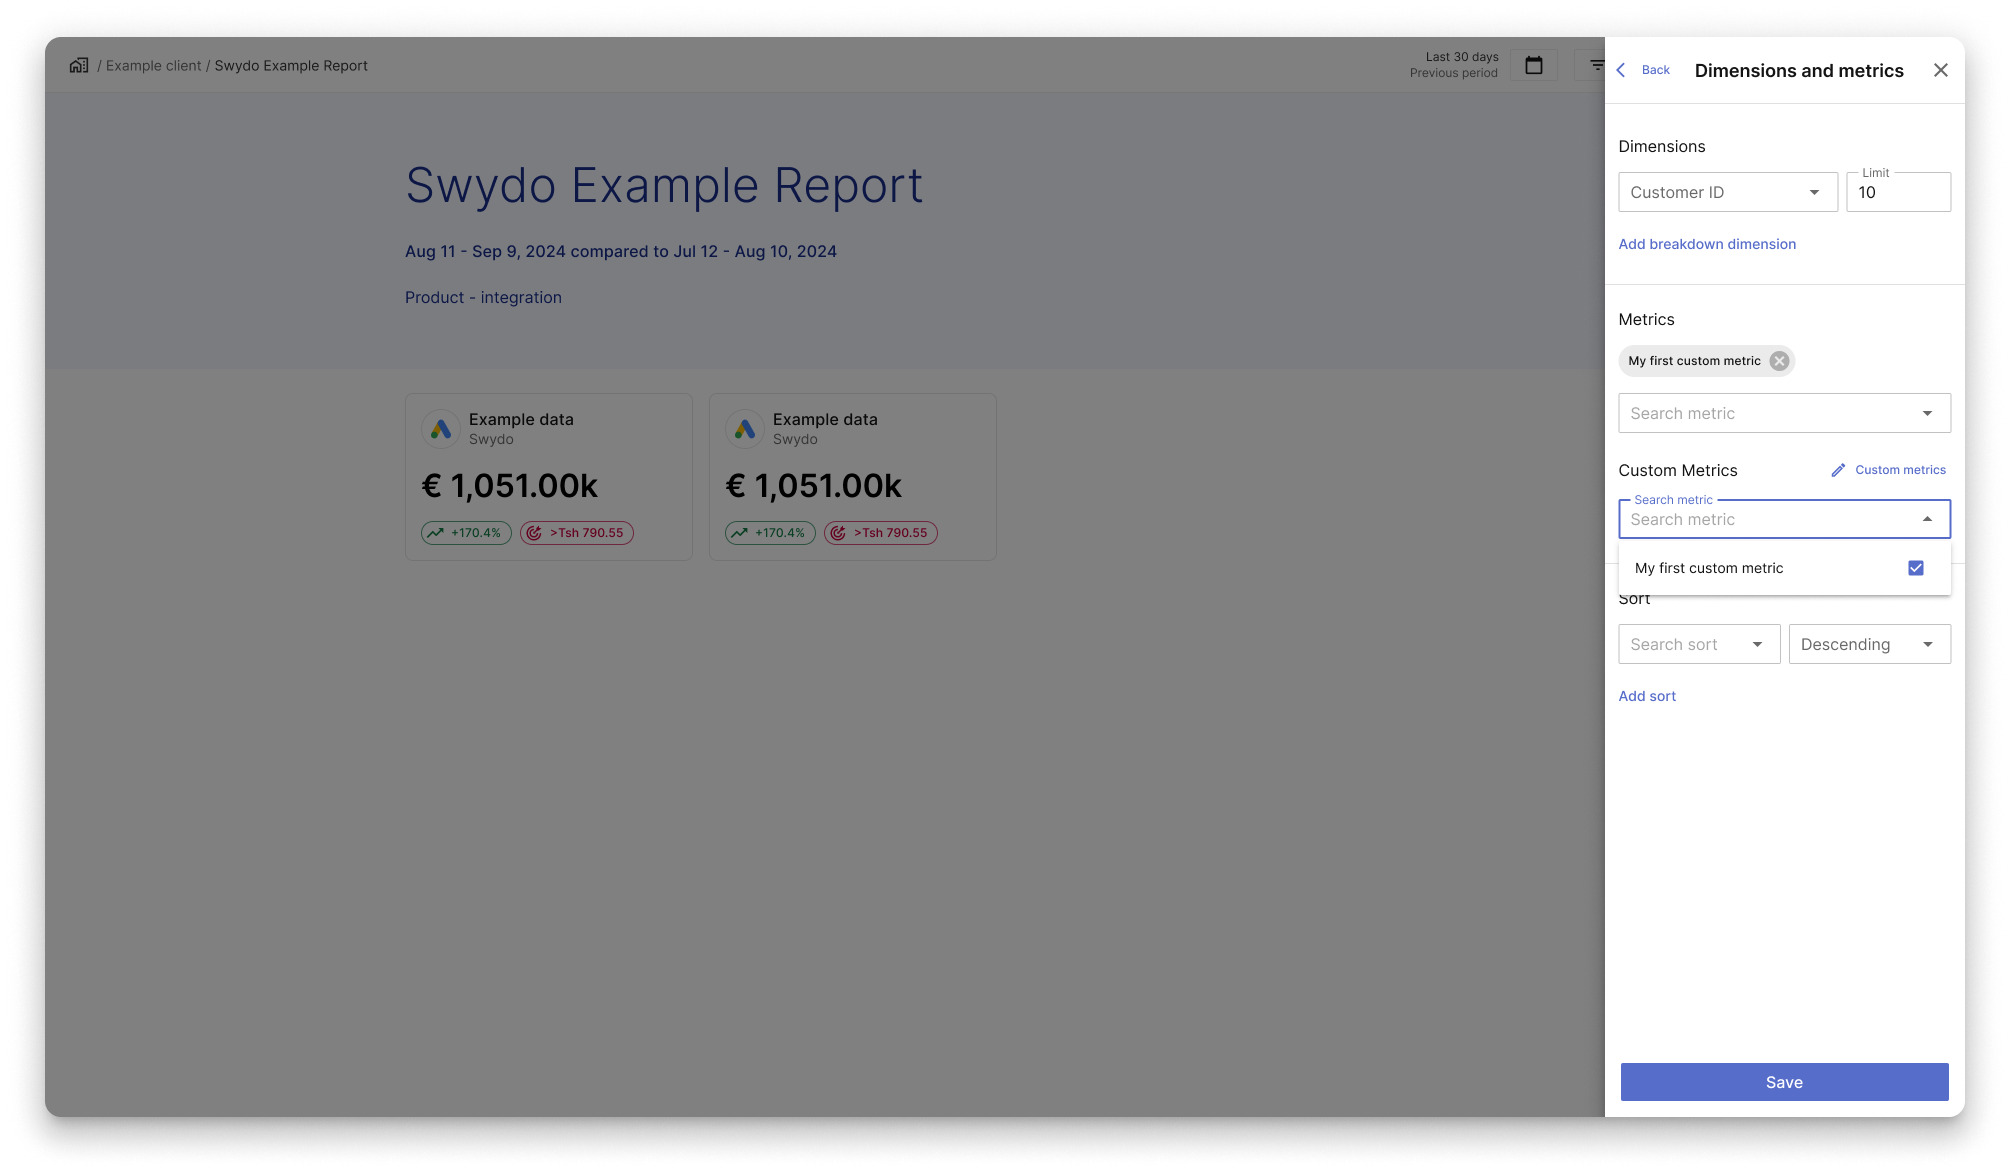
When the users select a custom metric, a chip will appear under the metrics label.
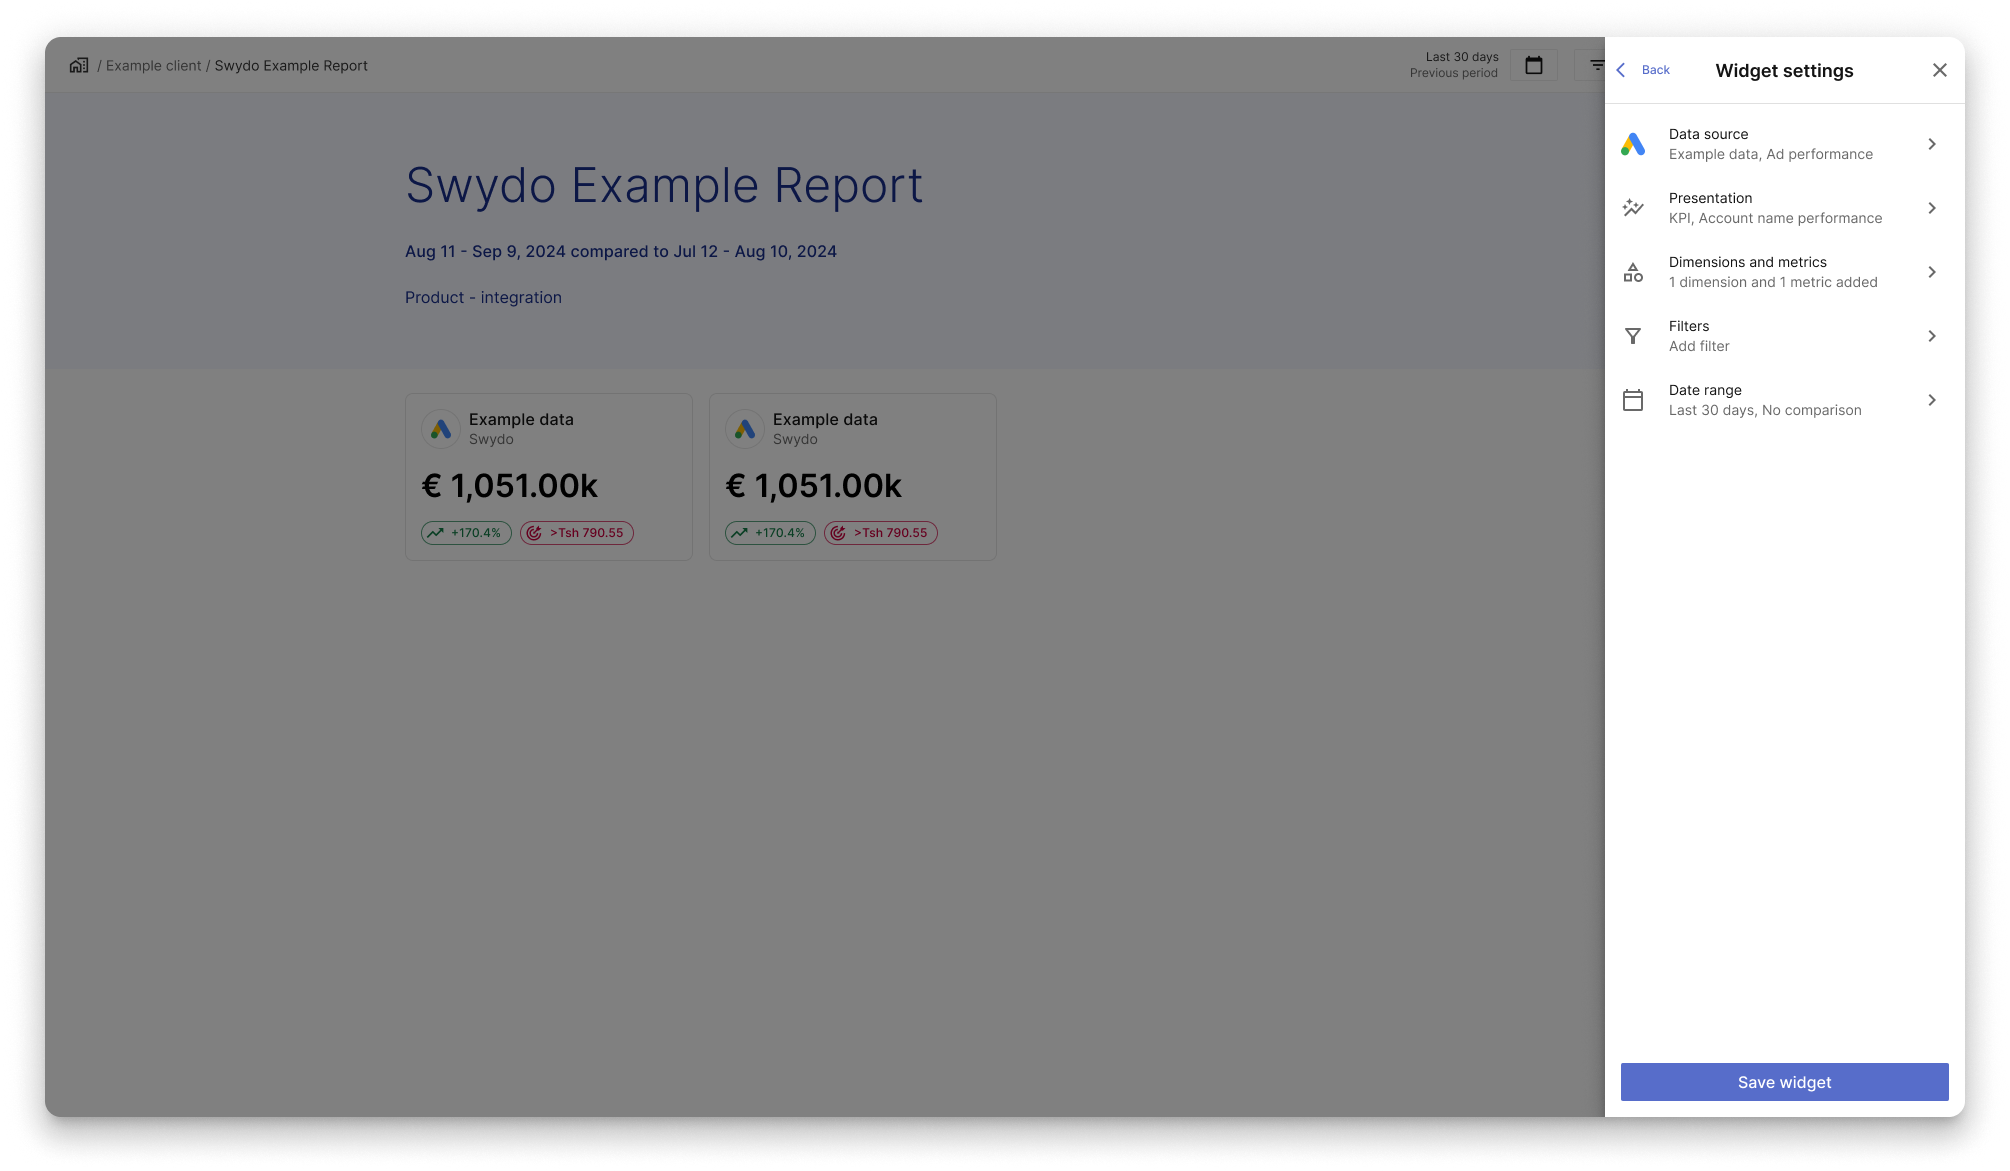
Once the custom metrics have been defined and applied,
users see it on the widget settings level, in the label under
dimensions and metrics.
